Tag Archives: trading

Financial Markets with Robert Shiller

Professor Shiller provides a description of the course, including its general theme, the relevant textbooks, as well as the interplay of his course with Professor Geanakoplos’s course “Economics 251–Financial Theory.” Finance, in his view, is a pillar of civilized society, dealing with the allocation of resources through space and time in order to manage big and important risks. After talking about finance as an occupation, he emphasizes the moral imperative to use wealth for the purposes of philanthropy, in the spirit of Andrew Carnegie, but also of Bill Gates and Warren Buffett. Subsequently, he introduces the guest speakers David Swensen, Yale University’s chief investment officer, Maurice “Hank” Greenberg, former Chief Executive Officer (CEO) at American International Group (AIG) and current CEO of C.V. Starr & Co. and of Starr International, and Laura Cha, former vice chair of the China Securities Regulatory Commission, member of the Executive Council of Hong Kong and of the government of the People’s Republic of China, and director of the Hong Kong Shanghai Banking Corporation (HSBC). Finally, he concludes with a description of the topics to be discussed in each lecture.

Here is the videos : FINANCIAL MARKETS WITH ROBERT SHILLER

Related Posts

For investors, the key to 2017 will


For investors, the key to 2017 will not be Brexit, nor the French elections but rather USA bond yields. If the 10-year yield breaches 3pc we would expect major dislocations in many markets and a huge repricing of assets across the globe.

Related Posts

  • 80
    The worst-ever trading outage on the world's most important agricultural markets was triggered when sophisticated technology tripped over a trading halt in a single market, the executive chairman of exchange operator CME Group Inc told Reuters. The April 8 outage stopped electronic trading in 31 agricultural markets that influence global…
    Tags: trading, markets, usa
  • 75
    EUR/USD fresh highs after breaking through 1.3650 resistance and 50DMA at 1.3655  
    Tags: usa, trading
  • 67
    David Matsuda had never been a mariner or an administrator before he became the head of the U.S. Maritime Administration in 2009. He had been a government lawyer and a congressional staffer, focusing on railroad issues; the ringtone on his phone was the choo-choo of a train. Matsuda had never been…
    Tags: usa, trading
  • 65
    On Thursday Mohamed A. El-Erian was on CNBC`s Halftime Report and he said something that a lot of people have been saying regarding the bond market, and it needs to be cleared up, because the amount of poor understanding regarding the bond market by people who make their living, i.e.,…
    Tags: bond, trading
  • 64
    This month marks the fifth anniversary of the current bull market on Wall Street, making it one of the longest and strongest in history. Yet U.S. stock ownership is at a record low and less than half of Americans trust banks and financial services. And in the last two weeks,…
    Tags: trading, huge, usa

Shipping slowdown hints at a recession around the corner

( Source : http://www.newstatesman.com/politics/economy/2016/02/global-shipping-slowdown-hints-recession-around-corner )

The global shipping slowdown hints at a recession around the corner

Instability in China and tumbling commodity prices have devastated the world’s freight providers – a strong indicator of trouble to come.

This is beginning to have the feel of 2008 all over again. Policy makers around the world are in denial once again as global stock markets dive. In 2008, the slowing of the world’s biggest economy – the US – sent the global economy into a tailspin. The concern now is that the slowing of the second-largest economy, China, may well have similar global effects. Chinese growth, which averaged 10 per cent for three decades through to 2010, has decelerated for five straight years and in 2015 slowed to 6.9 per cent, its lowest rate in a quarter of a century. The IMF is forecasting that Chinese growth will slow further to 6.3 per cent in 2016 and 6 per cent in 2017, which may well be overly optimistic. There is already speculation that China’s banking system may see losses even larger than those suffered by US banks during the last crisis.

The bad news from China appears to have already spread to the US, which has seen GDP growth slowing sharply in the last quarter of 2015. US industrial production and core retail sales are both falling, and there have been marked contractions in core capital goods shipments and private non-residential construction. Business fixed investment declined nearly 2 per cent last quarter. Despite the bad news, last week Federal Reserve chair Janet Yellen astonishingly claimed that “the US economy is in many ways close to normal”. By contrast, Ruslan Bikbov from Bank of America Merrill Lynch calculates that there is a 64 per cent probability the US is already in recession. My expectation is the next move by the Fed will be to cut rates.

Company profits are tumbling as commodity and oil prices decline. BP reported a $3.3bn fourth-quarter loss last year while Exxon Mobil reported a 58 per cent fall in its quarterly profit. It isn’t just oil companies. Last week, Rio Tinto – the world’s second biggest mining company – reported profits down 51 per cent after commodity prices collapsed amid slowing growth from China. Company profits are also suffering due to a big decline in the amount of freight being moved, especially to and from China. Moeller-Maersk, the Danish conglomerate and the world’s biggest container-ship operator by capacity, last week reported a fourth-quarter net loss of $2.51bn.

DP World, one of the world’s biggest port operators, also says that global volume has slowed sharply. It reported that volumes at its ports rose by 2.4 per cent last year, compared with 8 per cent growth in 2014. Data provider Container Trades Statistics said this week that Asia-to-Europe trade fell nearly 4 per cent last year. Freight rates in 2015 averaged $620 per container on the Asia-to-Europe trade route. Typically, ship operators need more than $1,000 to break even. In February, the cost of moving a container from Shanghai to Rotterdam fell to $431, barely covering fuel costs. Figures released by the Shanghai Shipping Exchange show that the country’s 20 largest container ports grew by 3.7 per cent over 2014, compared to 5.5 per cent the previous year. The Hong Kong Port Development Council reported that throughput at the port of Hong Kong fell by 9.5 per cent in 2015.

The Baltic Dry Index (BDIY) – an index of the price for shipping dry goods such as iron ore and coal (oil is wet) as shown in the chart below – is at a record low of 290. It is down 75 per cent since its recent peak in 2015 and down 98 per cent from its peak of 11,793 points in May 2008. The collapse to 772 by 5 September 2008 (a week before Lehman Brothers failed) presaged the global recession and it is falling again. Capesize vessels, which are too big to get through the Suez or Panama canals, had an average daily hire last week of $1,484, compared with a peak of $233,988 in June 2008. Even though there is an oversupply of ships, global demand is collapsing.

The International Air Transport Association (IATA) released figures for global air freight, showing cargo volumes expanded 2.2 per cent in 2015 compared to 2014. This was a slower pace of growth than the 5 per cent recorded in 2014. This weakness apparently reflects sluggish trade growth in Europe and Asia-Pacific. “2015 was another very difficult year for air cargo,” said Tony Tyler, IATA’s Director General and CEO. “Growth has slowed and revenue is falling. In 2011 air cargo revenue peaked at $67bn. In 2016 we are not expecting revenue to exceed $51bn.”

The current contraction in rail freight is apparently reminiscent of the drop that started at the end of 2008 and carried on into 2009. China’s rail freight volumes fell by a significant amount last year. According to the National Development and Reform Commission (NDRC), volumes fell by 11.9 per cent, a further increase on the 2014 slowdown, when traffic declined by 3.9 per cent.

In the western US farm belt, grain trains are so abundant you can’t give one away. Since the middle of last March, carloads of agricultural products, chemicals, coal, metals, autos and other goods have declined every week. Shipments of US coal, the biggest commodity moved by rail, declined 12 per cent in 2015, according to the Association of American Railroads. The cost of carrying spring wheat from North Dakota to the Pacific coast has dropped by a third in the past two years. In early 2014, grain companies with a train to spare could command $6,000 per car above the official railway tariff, traders say. Today, to avoid hefty contract cancellation fees, they are paying others to use their unwanted trains.

Manufacturing output in the UK fell for each of the last three months and is down 1.7 per cent over the year. The overly optimistic Monetary Policy Committee is forecasting GDP growth of 2.2 per cent (2.4 per cent) in 2016; 2.4 per cent (2.5 per cent) in 2017 and 2.5 per cent (2.4 per cent) in 2018 (the latest, broadly similar, OBR forecasts in parentheses).

So all is well then? Probably not. Mark Carney has run out of ammunition with the Bank Rate at 0.5 per cent, compared with 5.5 per cent in 2008, and has little room to manoeuvre. Negative rates and more quantitative easing, here we come. George Osborne has never explained what he would have done differently in 2008 – his plans for a budget surplus are already in disarray as the economy slows. I am not saying a recession is going to happen any time soon, but it well might.

Related Posts

  • 82
    George Soros is 84 today. His career is remarkable both for its longevity and its returns – his Quantum fund has generated $39.6 billion in profits over the last four decades, making Soros the most successful hedge fund manager in history. How has Soros managed to stay at the top for so long?…
    Tags: $, cent, trading
  • 79
    https://www.youtube.com/watch?v=ZWz_Pln_uuI
    Tags: trading
  • 77
    http://www.swfinstitute.org/fund-rankings/
    Tags: trading
  • 76
    Forex: 10 Events to Watch Next Week In order of release 1. UK Consumer Price Index (Aug 19) 2. New Zealand Dairy Auction (Aug 19) 3. RBA Semi-Annual Testimony (Aug 19) 4. Bank of England Minutes (Aug 20) 5. FOMC Minutes (Aug 20) 6. HSBC China Manufacturing PMI Aug Flash…
    Tags: trading
  • 75
    Bill Gross’ spectacular fall from the top of the bond market has put tens of billions in play at a time when minuscule yields demand a fixed-income superstar. A brilliant, battle-scarred billionaire, Jeffrey Gundlach, stands ready to be coronated. Bond manager Jeffrey Gundlach is wearing a white T-shirt, faded blue…
    Tags: $, trading

2016 macro outlook

Related Posts

The optimal portfolio of risky assets is exactly the same for everyone

The optimal portfolio of risky assets is exactly the same for everyone :

1. Investors should control the risk of their portfolio not by reallocating among risky assets, but through the split between risky and risk-free assets.

2. The portfolio of risky assets should contain a large number of assets – it should be a well diversified portfolio.

Related Posts

  • 86
    https://www.youtube.com/watch?v=ZWz_Pln_uuI
    Tags: trading
  • 83
    http://www.swfinstitute.org/fund-rankings/
    Tags: trading
  • 82
    Forex: 10 Events to Watch Next Week In order of release 1. UK Consumer Price Index (Aug 19) 2. New Zealand Dairy Auction (Aug 19) 3. RBA Semi-Annual Testimony (Aug 19) 4. Bank of England Minutes (Aug 20) 5. FOMC Minutes (Aug 20) 6. HSBC China Manufacturing PMI Aug Flash…
    Tags: trading
  • 80
    This paper considers an asset market where investors have private information not only about asset payoffs, but also about their own exposure to an aggregate risk factor. In equilibrium, rational investors disagree about asset payoffs: Those with higher exposure to the risk factor are (endogenously) more optimistic about claims on…
    Tags: risk, investors, trading
  • 80
    There is a reason why I recommend everyone download (and read) this document. Not only is it free but it provides both novice and experienced investors with some perspective on some very basic issues. For example, the next time some one says you should divest your portfolio of so-called “sin…
    Tags: portfolio, investors, trading

10%= correction, 20%= bear market.

( Source : https://theirrelevantinvestor.wordpress.com/2016/01/12/probably-everything-you-need-to-know-about-bear-markets/ )

stock-market-correction

10%= correction, 20%= bear market.

I know these arbitrary numbers sometimes seem silly, but when looking at the data, you have to draw the line somewhere. Get over it, let’s move on.

The S&P 500 has been in a drawdown for the last eight months. Stocks are currently 9.2% below the highs made in May 2015, just a hair away from official correction territory. Everyone knows this is totally normal, but you might be surprised to know that since 1928, stocks have been in a 10% drawdown 55% of the time. The problem of course is that they never feel normal because we don’t know in real time if this is just a correction or the start of a bear market. And the deeper stocks go, the harder it is to resist fear’s temptation.

In times like this, historical facts don’t provide much comfort and even less of a roadmap, however, hopefully they can provide a little context.

Since 1928, there have been fifteen separate drawdowns of 10%. Before I continue, you might be thinking, “only fifteen corrections, that doesn’t sound right.” Here’s how I look at drawdowns; in my mind, a drawdown is not over until new highs are made. Of these fifteen corrections, ten have turned into a bear market.

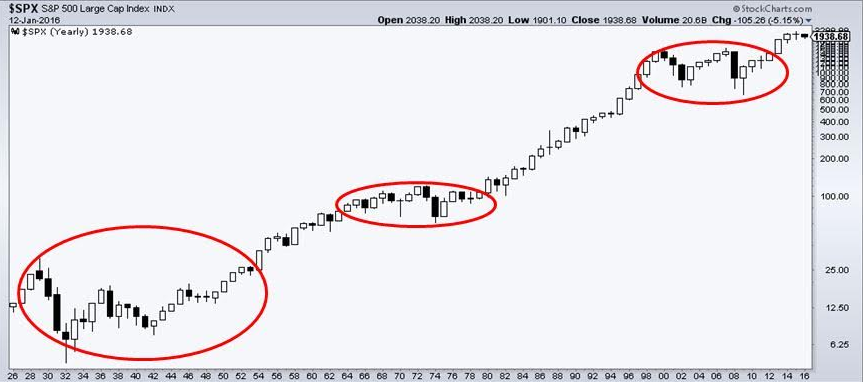
Let’s take a closer examination of these 20% declines because not all bear markets are created equal. There are secular bear markets, which by their nature can only be defined after the fact. These are long periods of time in which stocks make little progress. Then there are cyclical bears, which can come in the middle of a long secular bear or even a secular bull. The chart below shows the three secular bears over the last ninety years.

Screen Shot 2016-01-12 at 8.36.44 PM

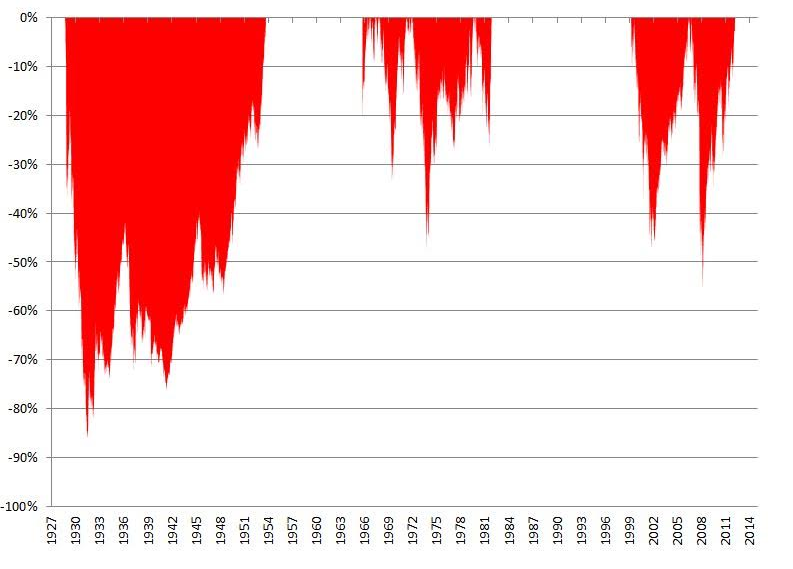
As you can see, the defining characteristic for secular bears is that stocks make no progress for long periods of time. Even worse, they experience severe declines which can scar an entire generation of investors. The chart below shows the painful drawdowns investors witness during these secular bear markets.

Screen Shot 2016-01-12 at 8.37.59 PM

The frustrating thing about each and every bear is it’s impossible to know how long they will last. Think about the most recent secular bear, which lasted from March 2000 through March 2013 (I think it’s over, though reasonable people can disagree on this). Stocks briefly poked their heads above their 2000 highs in October 2007 before being slammed right back into their decade long range. Investors had a similar experience in 1980; break above the long range for a minute only to be delivered one final gut punch.

Screen Shot 2016-01-12 at 8.38.28 PM

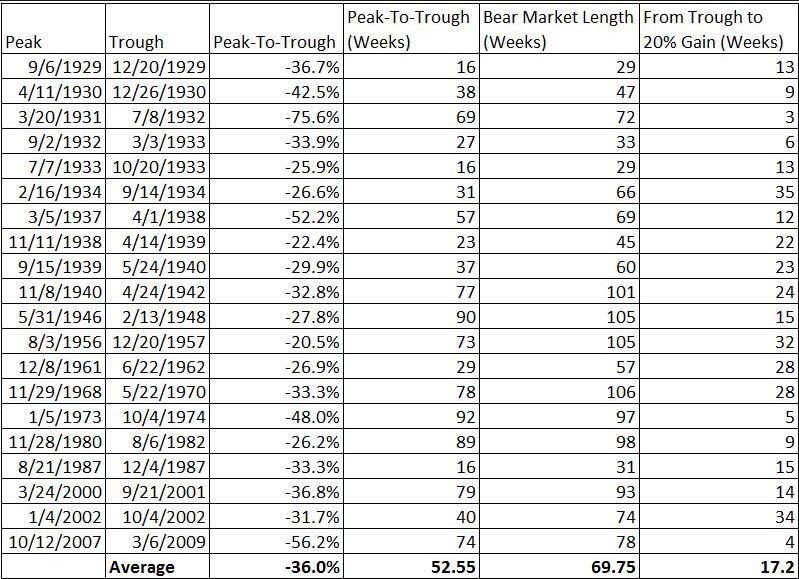
Looking at bear markets over long periods of time might not be as helpful as breaking them down further. Within the three secular bears have been distinct cyclical bears (think the tech bubble of 2000 and credit bubble of 2007). Here is how I’ve compiled the data below; any time there is a 20% rally, the bear market is over. What this does is break up 1929-1954 period into 11 separate bear markets.

The average of these 20 distinct bear markets saw a 36% peak-to-trough decline, lasting just over 52 weeks. The fifth column shows how long each bear was and the the sixth column shows how quickly stocks gained 20% from their lows, resetting the bear market. For instance, the October ’07 peak to the March ’09 lows was 74 weeks. Stocks then rallied 20% in 4 weeks, making 78 weeks the total length of that particular bear market.

Screen Shot 2016-01-12 at 8.38.13 PM

Whether the S&P 500 sees a correction, and whether or not that turns into a bear market, and how deep it might go and how long it might last is anybody’s guess. The only thing in your control is what you choose to do or not do. Making decisions in the heat of the moment is almost never a good idea, which is why having a plan in place is so important. Knowing that you have an answer, whether stocks go up, down or sideways a is really liberating feeling.

Related Posts

  • 72
    https://www.youtube.com/watch?v=ZWz_Pln_uuI
    Tags: trading
  • 71
    There is a reason why I recommend everyone download (and read) this document. Not only is it free but it provides both novice and experienced investors with some perspective on some very basic issues. For example, the next time some one says you should divest your portfolio of so-called “sin…
    Tags: time, stocks, trading
  • 71
    Embarking on a trading adventure involves developing a systematic strategy, understanding trend following, and mastering risk management. Drawing on resources like Covel's "Trend Following" and Schwager's "Market Wizards," traders must cultivate patience and discipline. Continual learning and adaptation are crucial to navigating the ever-changing markets and achieving long-term success.
    Tags: trading, market
  • 70
    http://www.swfinstitute.org/fund-rankings/
    Tags: trading
  • 70
    1. The only leading indicator that matters Watch the market leaders, the stocks that have led the charge upward in a bull market. That is where the action is and where the money is to be made. As the leaders go, so goes the entire market. If you cannot make money in…
    Tags: market, stocks, time, trading

In the stock market, short term trends are mostly random and heavily influenced by luck

(Source :  http://jimoshaughnessy.tumblr.com/post/137235375474/short-term-luck-versus-long-term-skill )

Daniel Kahneman, one of the fathers of behavior economics, said one of his favorite papers was “On the Psychology of Prediction (1973).” He claims in the paper that intuitive predictions are often unreliable because people base their predictions on how well an event fits a story. In behavioral economics, this phenomena is called a judgmental heuristic—representativeness, or how familiar you are personally with the story. This is one of the worst ways to make a forecast, because it uses a highly limited data set and allows the law of small numbers to mislead you and your forecast. For example, one study showed that when a doctor is told that a procedure works 50 percent of the time (essentially a coin toss probability or base rate) he or she could get the majority of patients to undergo the procedure if he or she simply added “The last patient who did this is doing great!” The story of success eliminates consideration of the base rate.

I recommend that to successfully make predictions about the long-term results of something such as an investment strategy or the overall direction of a market, you must consider three things:

1.      The long-term base rate of the success or failure of the strategy you are evaluating;

2.      The tendency of systems where both luck and skill are involved to revert to the mean and;

3.      What happened historically after certain extreme observations.

So, for example, when I wrote the commentary entitled “A Generational Buying Opportunity” in March of 2009, I was not relying on any particular insight that I might have had at the time, but rather on the data available to me about what happens in markets after they reach an extreme infection point.  It’s important to remember that the stock market is a complex, adaptive system with feedback loops that has elements of both luck and skill. Luck, in the stock market, essentially holds sway over the short-term and is a specific chance occurrence that affects the overall market or individual stock or portfolio can be either good or bad. Luck is a residual—it’s what is left over after you subtract skill from the outcome.

How much luck is involved determines the range of outcomes—where little luck is involved, a good process will almost always lead to a good outcome. Where a measure of luck is involved, a good process will usually have a good outcome, but only over longer periods of time. The luck/skill continuum in investing is almost entirely a function of time. Over shorter periods, your results are highly contingent on luck and chance. This is vital to understand because you might see a bad process provide excellent results due entirely to chance and a good process provide poor results for the same reason.

Consider a simple intuitive strategy of buying the 50 stocks with the best annual sales gains. But consider this not in the abstract but in the context of what had happened in the previous five years:

Year                            Annual Return            S&P 500 return

Year one                      7.90%                          16.48%

Year two                     32.20%                        12.45%

Year three                   -5.95%                         -10.06%

Year four                     107.37%                      23.98%

Year five                     20.37%                        11.06%

Five-year

Average Annual

Return                         27.34%                        10.16%

$10,000 invested in the strategy grew to $33,482 dwarfing the same investment in the S&P 500, which grew to $16,220. The three-year return (which is the metric that almost all investors look at when deciding if they want to invest or not) was even more compelling, with the strategy returning an average annual return of 32.90% compared to just 7.39% for the S&P 5000. Also consider that these returns would not appear in a vacuum—if it was a fund it would probably have a five start Morningstar rating; it would probably be featured in business news stories quite favorably and the “long-term” proof would say that this intuitive strategy made a great deal of sense and would attract a lot of investors.

Here’s the catch—the returns shown are from “What Works on Wall Street” and are for the period from 1964 through 1968, when, much like the late 1990s, speculative stocks soared. Investors without access to the very long-term results to this investment strategy would not have the perspective that the longer term brings, and without these tools, might have jumped into this strategy right before it went on to crash and burn. As the data from What Works on Wall Street makes plain, over the very long term, this is a horrible strategy that returns less then U.S. T-bills over the long-term. Had this investor had access to long-term returns, he or she would have seen that buying stocks based just on their annual growth of sales was a horrible way to invest—the strategy returned just 3.88 percent per year between 1964 and 2009! $10,000 invested in the 50 stocks from All Stocks with the best annual sales growth grew to just $57,631 at the end of 2009, whereas the same $10,000 invested in U.S. T-Bills compounded at 5.57 percent per year, turning $10,0000 into $120,778. In contrast, if the investor had simply put the money in an index like the S&P 500, the $10,000 would have earned 9.46 percent per year, with the $10,000 growing to $639,144! An investment in All Stocks would have done significantly better, earning 11.22 percent per year and turning the $10,000 into $1.33 million! What the investor would have missed during the phase of exciting performance for this strategy is that, in the end, valuation matters, a lot.

This is a good example of why Kahneman’s paper is so important—people make forecasts not on the data, but how well the prediction fits their perspective and the story behind it. Extrapolating from a small data set can be disastrous to long-term results. The “Most Dangerous Equation” was derived by Abraham de Moivre and states that the variation of the mean is inversely proportional to the size of the sample. A small sample tells you nothing about the true direction of results. Using a small sample—as we see above—can lead to costly errors over the long term.

What this tells us


1.      Investors are well advised to look at short-term performance as a worthless indicator for what will happen over the long-term. Indeed, short-term performance can be among the most misleading to investors and should be heavily discounted. The stock market combines both luck and skill, with luck more pronounced over short time periods, and skill more telling over long periods of time.

2.      Investors should make decisions using the long-term base rates a strategy exhibits—in other words, they should concentrate on what is probable rather than what is possible. If you organized your life around things that might possibly happen to you, you’d probably never leave your house, and when you did, it would only be to buy a lottery ticket. Consider, on a drive to the supermarket, it is highly probable that you will get there, buy your groceries and get back home to unpack them without incident. But what’s possible? Almost anything—it’s possible a plane flying overhead could lose an engine falling directly on your car and instantly killing you. It’s possible another car runs a red light and kills you on impact. It’s possible that you get carjacked and your assailant kills you in the process. You get the point—anything is possible but highly improbable. It’s only when you think in terms of probability that you will get in your car and go, yet few investors do so when making investment decisions. Our brains create cause and effect narratives after something has occurred that seem to make sense, however improbable the event. Witness anyone who invested in the stocks with the highest sales gains after a great short-term run.

3.      In the stock market, short term trends are mostly random and heavily influenced by luck. To succeed, you must ignore them and invest in strategies that have the highest probability (base rate) of succeeding in the future.

4.      You will not win the lottery. Avoid buying tickets and avoid what my son, Patrick O’Shaughnessy, calls lottery stocks.

5.      Over short periods of time, a good investment strategy can lead to poor results just as a poor investment strategy can lead to good results. Do your homework; understand how a strategy performs over long periods of time and stick with it. If you can do just this one thing, you will be ahead of the vast majority of investors over the long-term.

Related Posts

  • 55
    1. The only leading indicator that matters Watch the market leaders, the stocks that have led the charge upward in a bull market. That is where the action is and where the money is to be made. As the leaders go, so goes the entire market. If you cannot make money in…
    Tags: market, will, stock, stocks, time, trading
  • 54
    George Soros is 84 today. His career is remarkable both for its longevity and its returns – his Quantum fund has generated $39.6 billion in profits over the last four decades, making Soros the most successful hedge fund manager in history. How has Soros managed to stay at the top for so long?…
    Tags: returns, short, $, long, investors, year, trading
  • 53
    Embarking on a trading adventure involves developing a systematic strategy, understanding trend following, and mastering risk management. Drawing on resources like Covel's "Trend Following" and Schwager's "Market Wizards," traders must cultivate patience and discipline. Continual learning and adaptation are crucial to navigating the ever-changing markets and achieving long-term success.
    Tags: trading, market, strategy
  • 52
    Enhancing your trading approach requires strategic discipline and a commitment to certain principles that guard against common pitfalls. Here are six ways to level up your trading, ensuring that you maximize gains while minimizing losses: 1. No Big Losses (Cut Losses Quickly) Implement a strict stop-loss policy to protect your…
    Tags: trading, stocks, strategy, short, returns, consider, market, stock
  • 52
    While the setup is undeniably important, it's the process that often holds the key to resolving trading problems and unlocking the full potential of any trading strategy. A focus on developing, refining, and adapting the trading process can empower traders to achieve consistent success, even in the face of imperfect…
    Tags: process, trading, strategy, market

China runaway train ?

David Dredge of global hedge fund Fortress has built a career studying, predicting and protecting against the world’s major financial crises. The recent convulsions in global sharemarkets are “just the beginning” of a painful adjustment as money drains from the emerging market economies, he says.

“August 2015 will go down in the record books, much like July 2007 or July 1997, as the beginning of the coming contractionary cycle,” says Dredge who is the co-chief investment officer of Fortress Convex Asia Fund.

August 2015 will go down in the record books, much like July 2007 or July 1997, as the beginning of the coming contractionary cycle.

David Dredge, Fortress

He’s a believer that markets move in long cycles, which “despite all efforts to the contrary, central bankers have not by any means gotten anywhere close to eliminating”.

Hedge fund Fortress says all emerging economies are in the midst of a painful adjustment after a "burst of credit expansion".Hedge fund Fortress says all emerging economies are in the midst of a painful adjustment after a “burst of credit expansion”. Photo: AP

“Like weathermen have not eliminated seasons,” he says.

Singapore-based Dredge says the current volatility in financial markets is in the early stage as markets react to a correction of global imbalances that will last from18 months to three years.

The global economy is made up of nations with a deficit of capital – the West – and those with a surplus of capital – the East and emerging markets, he explains.

Policy determined by deficit

“The flaw is that those with the surplus have all tied their currency to the main protagonist on the deficit side – the US.

“So monetary policy is determined by the deficit of capital side and flows through the currency linkage, and you end up having some form or another of the same monetary policy on both sides, with economies that are 180 degrees diametric to each other.”

The financial links to easy-money policies in the US have unleashed a burst of credit expansion in emerging markets that has proved unsustainable and is now in the process of unwinding.

That is forcing a painful “market-induced tightening” that will affect  the growth of emerging markets as credit expansion is halted and reverses.

The “simplest measure of these imbalances” is foreign exchange reserves, which have swelled in the past few years but are now being liquidated, tightening financial conditions in emerging markets.

“When the hose is on and credit is pouring from the deficit to the surplus side, the FX [foreign exchange] reserves increase and are indicative of the growing size and the location as to where the imbalances exist – because that’s where the most money is going.”

China’s foreign currency reserves peaked at $US4 trillion ($5.7 trillion) in mid-2014 but have since run down to about $US3.6 trillion.

‘In the inverse of imbalance’

“Each crisis occurred at the peak of FX reserves. The emerging-market FX-reserves graph looks exactly like the US debt to GDP because they are just in the inverse of the imbalance.”

Dredge says that differentiating among emerging economies misses the point of what is occurring. Capital is draining from the emerging markets as conditions have tightened, and has been since the “taper tantrum” of May 2013.

“In December 1999 the point wasn’t whether you should invest in Apple or Microsoft. The point was they were both going down [as the tech bubble deflated]. And that’s where we are now.

“The [credit] contraction might be triggered in China with retail margin lending in the equity market, or in Malaysia with recognition of corruption.

“But the trigger is not what we are trying to compare. It’s the potential risk, which is the excess credit creation in the last cycle. In that sense Brazil, China and Malaysia are all the same.”

Dredge co-manages the Convex Asia fund, a “volatility fund”, which manages about $US200 million and seeks to deliver outsized gains in times of market stress.

Stay ahead of spreading fire

He says he’s attempting to stay ahead of the spreading fire and that means looking for cheap exposures to volatility. Interest rate volatility is low and, while foreign currency volatility may have risen, it is below many of the peaks reached over the past five years. Corporate credit spreads, too, are around post-financial crisis lows despite a fair-sized correction in corresponding equities.

“This is indicative that we’re just at the very beginning of this,” Dredge says.

Where does Australia fit in as the cycle turns dark for emerging markets? We’re special in the sense that we have not pegged our currency to the US.

“It is just about the only non-manipulated currency in the entire world, along with New Zealand. By allowing the currency to move and avoid being a hard linkage to the monetary policy whims of the global reserve currency, it takes a lot of the pressure off.”

But there has still been a build-up of risks as credit has grown virtually interrupted and our economic linkages to China make us vulnerable to, not immune from, any shocks.

“Australia came through many of the last several cycles better than most because most of the volatility was allowed to take place in the currency.

“This has allowed the asset volatility to be far less than it otherwise would have been. But that means credit has built up and imbalances, while far less than they would have been, have been allowed to persist.”


Related Posts

  • 61
    Deutsche Bank has fired three currency traders in New York as regulators worldwide ramp up their investigations into potential manipulation of the $5-trillion-a-day foreign exchange market, according to a person briefed on the matter. The three employees include the head of Deutsche Bank’s emerging markets foreign exchange trading desk in…
    Tags: exchange, foreign, currency, markets, emerging, trading, market, fire
  • 61
    The move in March by the People’s Bank of China (PBOC) to double the RMB’s daily trading band from 1 percent to 2 percent has coincided with a new era of exchange rate volatility. This year, the long running trend of RMB appreciation has reversed course with it losing 3.4 percent against…
    Tags: currency, fx, trading, markets, global, exchange, china
  • 59
    The hedge fund industry used to have humble beginnings: in 1990, it had $40 billion in assets under management. Now, its growing appeal has led to a staggering $2.6 trillion in 2013. In retrospect with the mutual funds industry and the global financial markets, this is a small figure. However,…
    Tags: hedge, fund, trading
  • 58
    What is a Hedge Fund?  A hedge fund is an aggressively managed investment fund that is maintained by a professional management firm. Hedge funds are typically a portfolio of investments that makes use of advanced and complex investment strategies like short and long positions, leveraged positions, arbitrage, and derivative positions…
    Tags: hedge, fund, trading
  • 58
    Currency traders are having their worst start to a year since 2010 as a dearth of trends in major foreign-exchange markets crushes their investment strategies. Deutsche Bank AG’s Currency Returns Index has dropped 0.3 percent since Dec. 31, dragged down by momentum trading, where investors looks for consistent moves in…
    Tags: currency, trading, years, markets

This is a cyclical downturn this is a cyclical downturn

( Source : http://www.bloombergview.com/articles/2015-08-31/maybe-this-global-slowdown-is-different )

The global economy is slowing down. A couple of the big emerging-market economies that drove much of the growth during the past 15 years have hit a wall, and the question of the moment is whether the biggest of them, China, is in real trouble too. Commodity prices are tanking. Trade volumes are down. The Baltic Dry Index of shipping costs, which rebounded from a record low earlier this year, is falling again.

These are all characteristic of a cyclical downturn. And this is a cyclical downturn — oil prices will rise again someday. So will emerging-market stock and bond prices.

But there could also be something else afoot. We could be seeing early signs of longer-term changes in the global economy — changes that could be enormously positive, but also have the potential to upend a lot about how the world works today.

At this point these are just inklings, but I did what I always do when I have an inkling: I made some charts. First, here’s the picture on global trade:

global trade

After a spectacular rise in the 2000s, trade volumes plummeted after the 2008 financial crisis. They then recovered, but declined again in 2013. More up-to-date figures for just the G7 and BRIICS countriesshow that the decline may be accelerating.

trade slowdown new

Again, these things do go in waves. But there’s good reason to think that the trade gains of the 1990s and 2000s probably won’t be replicated anytime soon. As Michael Francis and Louis Morel of the Bank of Canada summed up in a recent report:

[T]rade reforms and technological innovations that lowered trade costs during the 1990s had a substantial effect on global trade by encouraging emerging markets to integrate into the global economy and by making global value chains economically viable. As a result, global trade rose relative to GDP. However, since this process is largely complete, the underlying incentives to expand trade are likely weaker now than they were in previous decades, leaving the world in a state where trade is neither rising nor falling relative to GDP.

A related argument is the one that’s been made by Harold Sirkin of the Boston Consulting Group for several years: Building global supply chains became so fashionable for Western manufacturers that they built them even when it made sense to keep production closer to customers; now they’re retrenching and revising their approach.

Still, I can’t help but thinking (perhaps wishfully thinking) that what we’re seeing might also be the beginnings of a plateauing in the world’s demand for things — and, even more, the resources needed to make those things. After all, the latest United Nations population projections, released in July, do indicate that we may be nearing a plateauing of the number of people on the planet.

population

Still, in the median forecast, the plateauing won’t happen till the end of the century. It’s possible that it won’t happen at all. Also, there are still billions of people around the world hoping to emerge from poverty and consume more things and resources. We’d have to see already-affluent people buying fewer things and consuming fewer resources to get the kind of shift I’m talking about. Are we seeing that?

Well, sort of. Here’s one remarkable shift the U.S. economy has made during the past 65 years:

goods services

The U.S. economy has grown so much during that period that people now are still buying more physical stuff than they did in 1950. Still, there are signs of a plateau. Consider what was long the iconic good produced by the U.S. economy, the automobile.

peak auto

The big growth years definitely seem to be over, even though U.S. population has kept growing. Still, this chart doesn’t exactly offer conclusive evidence. The trajectory on energy use is a little clearer.

energy

Americans use substantially less energy per capita now than they did in the 1990s. In Europe the trajectory is muddled by the entry of Eastern European countries into the global economy in the 1990s, which brought increased affluence and with it higher energy use — but the low level is an indication that the U.S. likely still has a lot of room to cut. The rapid growth in energy use in China was of course one of the factors behind the global natural resources boom that recently went bust.

The decline in Chinese demand for natural resources during the past year has been one of the main things prompting observers to wonder if the country is undergoing a much-sharper economic slowdown than the official numbers indicate. It may well be. But this also could be evidence of the Chinese economy’s shift away from resource-intensive manufacturing and infrastructure-building and toward providing services for Chinese consumers. In general, developing countries are making the switch from goods to services much earlier in their development than the U.S. and Europe did. This may not be all good news; economist Dani Rodrik worries that it might make it harder for them to catch up with wealthy countries. But it does mean less demand for things, and for the resources to make those things.

Finally, consider the things that people do want to spend their money on. The defining consumer product of our age is the smartphone. A smartphone is a good, and it takes resources to make and transport it. Still, it takes a lot less resources than, say, a car. Most of its value is in the software that is loaded onto it and the people, information and entertainment you can connect to with it. That’s a different sort of value creation than 20th-century resource-based value creation. If that’s the direction the global economy is headed in, the connections between growth, trade and resource consumption aren’t going to be the same as they have been. That is probably a good thing.

  1. G7: Canada, France, Germany, Italy, Japan, United Kingdom, United States. BRIICS: Brazil, the Russian Federation, India, Indonesia, China, South Africa.

This column does not necessarily reflect the opinion of the editorial board or Bloomberg LP and its owners.

To contact the author on this story:
Justin Fox at justinfox@bloomberg.net

Related Posts

  • 73
    Here are 10 warning signs that the markets may drop further. Vix fear gauge Rising US Treasury yields Credit insurance Rising US credit risk Rising UK bank risk Interest rate shock Bull market third longest on record Overvalued US market Commodity collapse Professional investors exit Watch those signs
    Tags: crash, trading
  • 71
    Brief History of that other economic designed crash of 1929 BBC documentary On October 29, 1929, Black Tuesday hit Wall Street as investors traded some 16 million shares on the New York Stock Exchange in a single day. Billions of dollars were lost, wiping out thousands of investors. In the…
    Tags: crash, prices, trading
  • 71
    The Dow had broken 17,000, the Standard & Poor's 500 Index had touched a record high and was spitting distance from crossing 2,000. Even the small-cap indexes such as the Russell 2000 and the S&P 600 have notched new highs. And the Nasdaq, up 255 percent since the March 2009…
    Tags: crash, good, trading, economy
  • 69
    There are serie parallels between the stock market’s recent behavior and how it behaved right before the 1929 crash. That at least is the conclusion reached by a frightening chart that has been making the rounds on Wall Street. The chart superimposes the market’s recent performance on top of a…
    Tags: crash, trading
  • 67
    Predicting big market crashes is a difficult business, many would say impossible. A pair of physicists - drawing inspiration from the market for bitcoin, no less -might be on to something. They turned to the bitcoin market because it has a unique feature, perhaps related to the fact that it is still…
    Tags: crash, trading

Why are hedge funds not updating data ?

Examining the HSBC Hedge Weekly voluntary performance update, it appears certain hedge funds, after some of the most volatile markets in years, have not been quick to post their performance, while others, such as Roy Niederhoffer, have enjoyed the recent market volatility.

HSBC 8 28

Hedge funds: Greenlight and Glenview hedge funds slow to report, while JPMorgan and Odey report mid-August update

Greenlight Capital’s David Einhorn, running $4 billion, for instance, has not been very quick to update his fund’s performance.  As of July 31 Greenlight was negative by -6.3 percent on the month and is off -9.32 percent on the year. Larry Robbins of Glenview Capital Partners has likewise not updated his $4.7 billion fund’s performance. It was off -2.04 as of July but was nonetheless up 4.87 on the year.

Funds with a European focus have been quicker to update their performance. JPMorgan’s Europe Dynamic Long / Short Fund, run by Jonathan Ingram, John Baker and Anis Lahlou-Abid, was up 1.83 percent on the month as of August 21, and is up 9.23 percent on the year. Crispen Odey 2.7 billion (euro) European Fund was up 1.9 percent on the month as of August 14, but was still down -11.84 percent on the year.

Hedge funds: Neuberger Merman, Lansdowne, Trian, Pershing Square and Marcato all report August performance

Neuberger Berman’s US Long Short Equity fund was quick to report and as of August 26 it was down -3.33 percent on the month and -2.88 percent on the year. The $9.7 billion Lansdowne Market fund as of August 21 was up 0.51 percent on the month and 10.71 percent on the year. The equity diversified US focused Marcato International, operated by Richard McGuire with $3.3 billion under management, was down -4 percent as of Aug 14 and is down -3.08 percent on the year.

Another fund to update performance on a relatively recent basis was Nelson Peltz $2.9 billion Trian Partners, which was down -2.75 month and -1.35 on the year as of August 21. The $6 billion Pershing Square Capital Management reported they were down 2 percent as of August 18, and was up 6.95 percent on the year. ValueWalk this morning reported more up-to-date performance for NAV, noting Pershing Square was down 13 percent in August.

Brevan Howard Asia Fund, with $2.6 billion under management, reported as of July 31 they were positive by 3.25 percent on the year, while the flagship Brevan Howard Fund, in the diversified global category with $21 billion under management, was up 1.96 percent on year as of July.

Top and Bottom 20 Hedge Funds August 28th, 2015 Hedge funds

Top and Bottom 20 Hedge Funds August 28th, 2015 Hedge funds

Paul Tudor Jones, Man AHL and Roy Niederhoffer like August

Paul Tudor Jones $8.4 billion Tudor BVI Global fund reported performance as of Aug 21 up 2.35 percent on the year, 0.36 percent positive on the month. Man AHL Alpha and its $3 billion under management were reported up 2.44 percent on the month and positive 3.99 percent on the year August 21, while Roy Niederhoffer enjoyed the recent volatility, he was up 6.4 percent on the month as of August 26.

In explaining the recent market behavior, Niederhoffer told ValueWalk:

While it is easy – and a constant of history — to place the blame on “speculators” for any market move that goes against the preferred direction, it’s almost always the case that the presence of speculators in a market adds, rather than removes, liquidity in a market. In fact, it may be the unnaturally low volatility in the equity market, which went nearly four years without a correction, was the positive result of a great deal of “speculation” that the market would rally. The current burst of volatility is merely a return to normal levels of volatility. Corrections of 5-10% in the stock market are quite common in history. Going four years without one is actually quite rare. Even current levels of volatility are nothing compared to truly turbulent markets like 2000 and 2008.

That having been said, I do expect volatility to be higher going forward, in keeping with the Fed’s decision to end QE (for now). QE certainly had a dampening effect on equity volatility, and I would expect a lack of QE, and a potential tightening in the future, to cause more volatility in the future. So yes – fasten your seatbelts!

source : http://www.valuewalk.com/2015/08/hedge-fund-august-returns/

Related Posts

  • 78
    The hedge fund industry used to have humble beginnings: in 1990, it had $40 billion in assets under management. Now, its growing appeal has led to a staggering $2.6 trillion in 2013. In retrospect with the mutual funds industry and the global financial markets, this is a small figure. However,…
    Tags: hedge, funds, fund, trading
  • 78
    What is a Hedge Fund?  A hedge fund is an aggressively managed investment fund that is maintained by a professional management firm. Hedge funds are typically a portfolio of investments that makes use of advanced and complex investment strategies like short and long positions, leveraged positions, arbitrage, and derivative positions…
    Tags: hedge, funds, fund, trading
  • 69
    Czech Republic wants a piece of the rising hedge fund industry, after a new EU regulation named AIFMD (Alternative Investment Fund Manager Directive)  takes effect in July. Previously the highest number of hedge funds, after the U.S., are domiciled in Luxembourg, a tiny EU state. But the new EU rules, which…
    Tags: hedge, funds, fund, trading
  • 68
    Commodity Futures Trading Commission data show the most-bullish six-week change to Aussie positions in more than 1 1/2 years over the period to April 22, just in time to catch a slump that made the local dollar the past week’s worst performer among 10 currencies tracked by Bloomberg Correlation Weighted…
    Tags: year, percent, market, funds, trading, hedge
  • 68
    George Soros is 84 today. His career is remarkable both for its longevity and its returns – his Quantum fund has generated $39.6 billion in profits over the last four decades, making Soros the most successful hedge fund manager in history. How has Soros managed to stay at the top for so long?…
    Tags: fund, billion, $, year, trading