Why did the market Crash ?

When stock markets are free-falling 10+% in a matter of days, it’s natural to seek some answers to the question “why now?”

Some are saying it was all the result of high-frequency trading (HFT), while others point to China’s modest devaluation of its currency the renminbi (a.k.a. yuan) as the trigger.

Trying to finger the proximate cause of the mini-crash is an interesting parlor game, but does it really help us identify the trends that will shape markets going forward?

We might do better to look for trends that will eventually drag markets up or down, regardless of HFT, currency revaluations, etc.

Five Interconnected Trends

At the risk of stating the obvious, let’s list the major trends that are already visible.

The China Story is Over

And I don’t mean the high growth forever fantasy tale, I mean the entire China narrative is over:

  1. That export-dependent China can seamlessly transition to a self-supporting consumer economy.
  2. That China can become a value story now that the growth story is done.
  3. That central planning will ably guide the Chinese economy through every rough patch.
  4. That corruption is being excised from the system.
  5. That the asset bubbles inflated by a quadrupling of debt from $7 trillion in 2007 to $28 trillion can all be deflated without harming the wealth effect or future debt expansion.
  6. That development-dependent local governments will effortlessly find new funding sources when land development slows.
  7. That workers displaced by declining exports and automation will quickly find high-paying employment elsewhere in the economy.

I could go on, but you get the point: the entire Story is over.  (I explained why in a previous essay, Is China’s “Black Box” Economy About to Come Apart? )

This is entirely predictable. Every fast-growing economy starting with near-zero debt and huge untapped reserves of cheap labor experiences an explosive rise as the low-hanging fruit is plucked and the same abrupt stall and stagnation when the low-hanging fruit has all been harvested, leaving only the unavoidable results of debt-fueled speculation: an enormous overhang of bad debt, malinvestment (a.k.a. bridges to nowhere and ghost cities) and policies that seemed brilliant in the good old days that are now yielding negative returns.

The Emerging Market Story Is Also Done

Emerging currencies and markets have soared on the back of the China Story, as China’s insatiable demand for oil, iron ore, copper, soy beans, etc. drove global demand to unparalleled heights.

This demand pushed prices higher, which then pushed production (supply) higher, as the low cost of capital globally enabled marginal resources to be put into production with borrowed money.

Now that China’s demand has fallen off—by some accounts, China’s GDP is actually in negative territory, despite official claims that it’s still growing at 7% annually—commodity prices have crashed, taking the emerging markets’ stock and currency markets down. (Source)

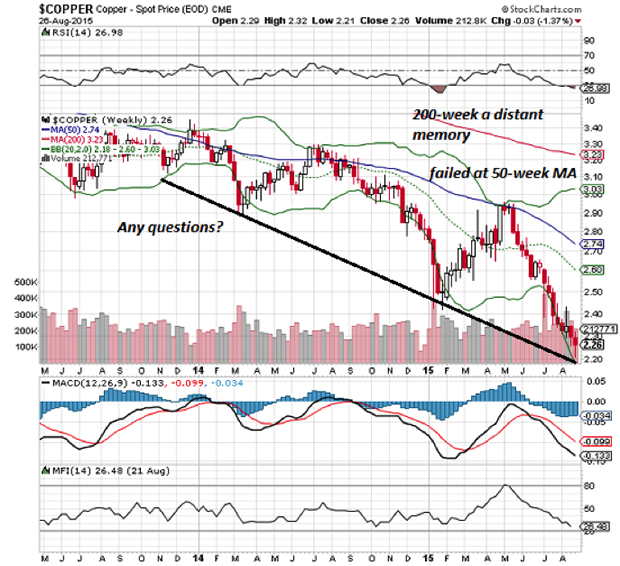
Here is a chart of Doctor Copper, a bellwether for industrial and construction demand:

Here is Brazil’s stock market, which has declined 54% in the past 12 months:

These are catastrophic declines, and with China’s growth story over, there is absolutely nothing on the global horizon to push demand back up.

Diminishing Returns on Additional Debt

The simple truth is that expanding debt has fueled global growth. Though people identify China as the driver of global demand for commodities, China’s growth is debt-driven. As noted above, China quadrupled its officially tracked debt from $7 trillion in 2007 to $28 trillion as of mid-2014—an astonishing 282 percent of gross domestic product (GDP).  If we add the estimated $5 trillion of shadow-banking system debt and another year’s expansion of borrowing, China’s total debt of $35+ trillion is in excess of 300% of GDP—levels associated with doomed to default states such as Greece and Spain.

While China has moved to open the debt spigot in recent days by lowering interest rates and reserve requirements, this doesn’t make over-indebted borrowers good credit risks or more empty high-rises productive investments.

Borrowed money that poured into ramping up production in emerging nations is now stranded as prices have plummeted, rendering marginal production intensely unprofitable.

In sum: greatly expanding debt boosted growth virtually everywhere after the Global Financial Meltdown of 2008-2009. That fix is a one-off: not even China can quadruple its $35+ trillion debt to $140 trillion to reignite growth.

Here is a sobering chart of global debt growth:

Limits on Deficit-Spending (Borrowed) Fiscal Stimulus

When the global economy rolled over into recession in 2008, governments borrowed money by selling sovereign bonds to fund increased state spending.  In the U.S., federal borrowing soared to over $1 trillion per year as the government sought to replace declining private spending with public spending.

Governments around the world have continued to run large deficits, piling up immense debts since 2008.  The global move to near-zero yields has enabled governments to support these monumental debt loads, but even at near-zero yields, the interest payments are non-trivial. These enormous sovereign debts place some limits on how much governments can borrow in the next global recession—a slowdown many think has already started.

Here is a chart of U.S. sovereign debt, which has almost doubled since 2008:

As noted on the chart: what structural inadequacies or problems did governments fix by borrowing gargantuan sums to fund state spending?  The basic answer is: none. All the same structural problems facing governments in 2008 remain untouched in 2015. These include: over-indebtedness, bad debts that haven’t been written down, insolvent banks, soaring social spending as the worker-retiree ratio slips below 2-to-1, externalized environmental damage that has yet to be remediated, and so on.

Central Bank Stimulus (Quantitative Easing) as Social Policy Has Been Discredited

In the wake of the Global Financial Meltdown of 2008-2009, central banks launched monetary stimulus programs aimed at pumping money into the economy via bank lending. The stated goals of these stimulus programs were 1) boost employment (i.e. lower unemployment) and 2) generate enough inflation to stave off deflation, which is generally viewed as the cause of financial depressions.

While it can be argued that these unprecedented monetary stimulus programs achieved modest successes in terms of lowering unemployment and pushing inflation above the zero line, they also widened wealth and income inequality.

Even as these programs made modest dents in unemployment and deflation, they pushed asset valuations to the moon—assets largely owned by the few at the top of the wealth pyramid.

Here is a chart of selected developed economies’ income/wealth skew:

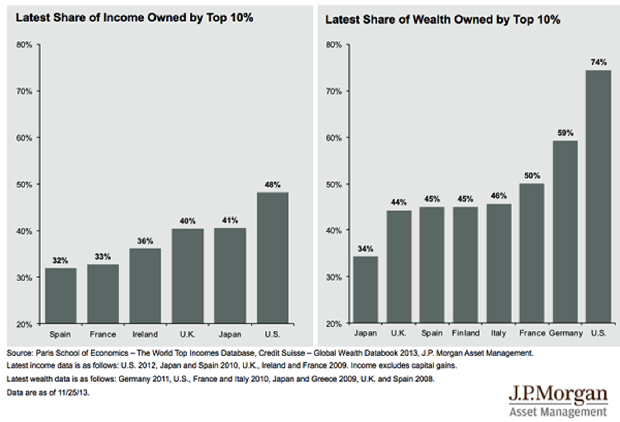
The widespread recognition that the benefits of central bank stimulus mostly flowed to the top of the pyramid places political limits on future central bank stimulus programs.

The 2008-09 Fixes Are No Longer Available

In summary, the fixes for the 2008-09 recession are no longer available in the same scale or effectiveness.  Expanding debt to push up demand and investment, rising state deficit spending, massive monetary stimulus programs—all of these now face limitations. This means the central banks and states have very limited tools to reignite growth as global recession trims borrowing, investment, hiring, sales and profits.


Related Posts

  • 77
    The yuan will be able to trade as much as 2% on either side of a daily central bank reference rate, compared with the current 1%  
    Tags: bank, central, will, china
  • 76
    China's central bank is prepared to take its strongest action since 2012 to loosen monetary policy if economic growth slows further, by cutting the amount of cash that banks must keep as reserves, sources involved in internal policy discussions say. A cut would be triggered if growth slips below 7.5…
    Tags: bank, central, growth, economy, china
  • 69
    China's central bank reiterated its stance of continuing with a stable monetary policy this year and promising to contain risks in lending, noting that the economy has yet to find a stable base for growth. In its quarterly monetary policy report, released on Saturday, the People's Bank of China (PBOC)…
    Tags: bank, china, central, growth, economy
  • 66
      When the banking crisis crippled global markets seven years ago, central bankers stepped in as lenders of last resort. Profligate private-sector loans were moved on to the public-sector balance sheet and vast money-printing gave the global economy room to heal. Time is now rapidly running out. From China to…
    Tags: markets, economy, central, china, global, growth, bank
  • 63
    (Source http://www.independent.co.uk/news/business/comment/david-blanchflower/david-blanchflower-we-should-fear-deflation--not-welcome-it-9986726.html ) The UK isn’t in deflation yet. While central bankers know what to do about stopping inflation, they don’t know what to do about halting deflation. The Swiss National Bank last week abandoned its attempt to defend a currency floor, which caused a sharp appreciation in its currency, which…
    Tags: economy, bank, central

Why are hedge funds not updating data ?

Examining the HSBC Hedge Weekly voluntary performance update, it appears certain hedge funds, after some of the most volatile markets in years, have not been quick to post their performance, while others, such as Roy Niederhoffer, have enjoyed the recent market volatility.

HSBC 8 28

Hedge funds: Greenlight and Glenview hedge funds slow to report, while JPMorgan and Odey report mid-August update

Greenlight Capital’s David Einhorn, running $4 billion, for instance, has not been very quick to update his fund’s performance.  As of July 31 Greenlight was negative by -6.3 percent on the month and is off -9.32 percent on the year. Larry Robbins of Glenview Capital Partners has likewise not updated his $4.7 billion fund’s performance. It was off -2.04 as of July but was nonetheless up 4.87 on the year.

Funds with a European focus have been quicker to update their performance. JPMorgan’s Europe Dynamic Long / Short Fund, run by Jonathan Ingram, John Baker and Anis Lahlou-Abid, was up 1.83 percent on the month as of August 21, and is up 9.23 percent on the year. Crispen Odey 2.7 billion (euro) European Fund was up 1.9 percent on the month as of August 14, but was still down -11.84 percent on the year.

Hedge funds: Neuberger Merman, Lansdowne, Trian, Pershing Square and Marcato all report August performance

Neuberger Berman’s US Long Short Equity fund was quick to report and as of August 26 it was down -3.33 percent on the month and -2.88 percent on the year. The $9.7 billion Lansdowne Market fund as of August 21 was up 0.51 percent on the month and 10.71 percent on the year. The equity diversified US focused Marcato International, operated by Richard McGuire with $3.3 billion under management, was down -4 percent as of Aug 14 and is down -3.08 percent on the year.

Another fund to update performance on a relatively recent basis was Nelson Peltz $2.9 billion Trian Partners, which was down -2.75 month and -1.35 on the year as of August 21. The $6 billion Pershing Square Capital Management reported they were down 2 percent as of August 18, and was up 6.95 percent on the year. ValueWalk this morning reported more up-to-date performance for NAV, noting Pershing Square was down 13 percent in August.

Brevan Howard Asia Fund, with $2.6 billion under management, reported as of July 31 they were positive by 3.25 percent on the year, while the flagship Brevan Howard Fund, in the diversified global category with $21 billion under management, was up 1.96 percent on year as of July.

Top and Bottom 20 Hedge Funds August 28th, 2015 Hedge funds

Top and Bottom 20 Hedge Funds August 28th, 2015 Hedge funds

Paul Tudor Jones, Man AHL and Roy Niederhoffer like August

Paul Tudor Jones $8.4 billion Tudor BVI Global fund reported performance as of Aug 21 up 2.35 percent on the year, 0.36 percent positive on the month. Man AHL Alpha and its $3 billion under management were reported up 2.44 percent on the month and positive 3.99 percent on the year August 21, while Roy Niederhoffer enjoyed the recent volatility, he was up 6.4 percent on the month as of August 26.

In explaining the recent market behavior, Niederhoffer told ValueWalk:

While it is easy – and a constant of history — to place the blame on “speculators” for any market move that goes against the preferred direction, it’s almost always the case that the presence of speculators in a market adds, rather than removes, liquidity in a market. In fact, it may be the unnaturally low volatility in the equity market, which went nearly four years without a correction, was the positive result of a great deal of “speculation” that the market would rally. The current burst of volatility is merely a return to normal levels of volatility. Corrections of 5-10% in the stock market are quite common in history. Going four years without one is actually quite rare. Even current levels of volatility are nothing compared to truly turbulent markets like 2000 and 2008.

That having been said, I do expect volatility to be higher going forward, in keeping with the Fed’s decision to end QE (for now). QE certainly had a dampening effect on equity volatility, and I would expect a lack of QE, and a potential tightening in the future, to cause more volatility in the future. So yes – fasten your seatbelts!

source : http://www.valuewalk.com/2015/08/hedge-fund-august-returns/

Related Posts

  • 78
    The hedge fund industry used to have humble beginnings: in 1990, it had $40 billion in assets under management. Now, its growing appeal has led to a staggering $2.6 trillion in 2013. In retrospect with the mutual funds industry and the global financial markets, this is a small figure. However,…
    Tags: hedge, funds, fund, trading
  • 78
    What is a Hedge Fund?  A hedge fund is an aggressively managed investment fund that is maintained by a professional management firm. Hedge funds are typically a portfolio of investments that makes use of advanced and complex investment strategies like short and long positions, leveraged positions, arbitrage, and derivative positions…
    Tags: hedge, funds, fund, trading
  • 69
    Czech Republic wants a piece of the rising hedge fund industry, after a new EU regulation named AIFMD (Alternative Investment Fund Manager Directive)  takes effect in July. Previously the highest number of hedge funds, after the U.S., are domiciled in Luxembourg, a tiny EU state. But the new EU rules, which…
    Tags: hedge, funds, fund, trading
  • 68
    Commodity Futures Trading Commission data show the most-bullish six-week change to Aussie positions in more than 1 1/2 years over the period to April 22, just in time to catch a slump that made the local dollar the past week’s worst performer among 10 currencies tracked by Bloomberg Correlation Weighted…
    Tags: year, percent, market, funds, trading, hedge
  • 68
    George Soros is 84 today. His career is remarkable both for its longevity and its returns – his Quantum fund has generated $39.6 billion in profits over the last four decades, making Soros the most successful hedge fund manager in history. How has Soros managed to stay at the top for so long?…
    Tags: fund, billion, $, year, trading

Everything you’ve heard about China’s stock market crash is wrong

(Source : http://qz.com/486476/everything-youve-heard-about-chinas-stock-market-crash-is-wrong/ )

This week’s Chinese stock market implosion has been widely viewed as a reaction to the Chinese government’s devaluing the yuan on Aug. 11—a move many presume was a frenzied bid to lower export prices and strengthen the economy.

This interpretation doesn’t stand up to scrutiny. First, Chinese investors haven’t been investing based on how the economy is doing, but rather, based on what they think the government will do to prop up the market. The crash, termed “Black Monday,” was more likely a reaction to the central bank’s failure over the weekend to announce a widely expected cut to the bank reserve requirement since previous cuts in February and April had boosted stock prices. The government eventually caved andannounced a cut on Tuesday (Aug. 25).

Second, the crash happened nearly two weeks after the devaluation, and the government only let the yuan depreciate by about 3% before swooping in and propping up its value again—which hardly helps exporters since the currency’s value effectively rose some 14% in the last year.

The devaluation probably had more to do with breaking the yuan’s tightly managed peg to the US dollar, an obligation that has been draining the economy of scarce liquidity as capital outflows swell.

Both moves—the government pulling back from its market bailout and the currency devaluation—stem from the same ominous problem: China’s leaders are scrambling to find the money to keep its economy running. To understand the broader forces that led to this predicament, here’s a chart-based explainer tracing its origins:

China used its exchange rate to stoke growth

China has long pegged its currency to the US dollar at an artificially cheap rate. Keeping the yuan cheaper than it should be, even as export revenues and foreign investment gushed in, allowed China to amass huge foreign exchange reserves, as we explain in more detail here:

A cheap currency has also powered China’s investment-driven growth model (more on this here). By paying more yuan than the market would demand for each dollar, the People’s Bank of China (PBoC) created extra money out of thin air, sending it sloshing around in the economy. (Meanwhile, the PBoC prevented from driving up inflation by setting its bank reserve requirements unusually high, as we explain here.)

Easy money, easy lending, easy growth. This was especially true after the global financial crisis hit, when China pumped 4 trillion yuan ($586 billion in 2008 US dollars) into its economy to protect it from the fallout. The resulting double-digit growth attracted foreign investment and hot money inflows, raising demand for yuan. To buoy its faltering export industry, the PBoC had to buy even more dollars to prevent surging yuan demand from driving up the local currency’s value.

1
1

The government pumped the stock market

But growth is now slowing, making the $28 trillion in debt China racked up in the process even harder to pay off.

About a year ago, the government turned to pumping up the stock market. The thinking behind this move, says Derek Scissors, economist at the American Enterprise Institute, was, “Hey, why not address our huge problems by replacing debt with equity?” In other words, a bull market would help indebted companies raise new capital and pay off overdue loans. But eventually the market tanked.

So starting in early July, the government launched a sweeping stock market bailout, vowing to prop up the Shanghai Composite Index until it hit 4,500. The problem is, every time it has neared that target level, investors start selling in anticipation that the government will pull back its support. As a result, the Chinese government has now spent as much as $1 trillion to prop up stocks.

Hot money fled the country

While some investors were betting on stocks, others had seen the writing on the wall and were getting out—swapping their yuan for other currencies. Starting in late 2014, the influx of hot money reversed course, and speculative investment flooded out of China. One measure of that is the drop in (mostly) short-term trade finance from foreign banks, which started in Q4 2014:

Another is the fall in foreign exchange that Chinese banks are holding:

Once people started selling the yuan, others began fearing that their yuan holdings would lose value—so they sold too. Lower demand for the yuan should have lowered the currency’s value relative to the dollar. But the PBoC had to keep the yuan’s value stable. Not only had it promised to do so as a requirement of joining the IMF’s basket of central bank reserve currencies; the yuan’s stability and gradual appreciation has long attracted foreign capital into China, says Carlo Reiter, an analyst at J Capital Research. To continue propping up the yuan’s value, the PBoC started selling dollars from its precious reserves in exchange for yuan:

Buying back yuan lowered liquidity, however, which raised borrowing costs, putting a damper on borrowing and investment and threatening deflation:

Higher borrowing costs exacerbated the country’s $28 trillion in debt, much of which has been borrowed at variable interest rates.

The rising stock market crimped bank lending

As investors shifted money from their banking deposits into brokerage accounts to buy stocks, liquidity tightened, leaving banks with less money to lend, says Christopher Balding, finance professor at Peking University. To keep the economy growing, the government continued to pressure banks to lend.

To help keep credit flowing, the Chinese government launched a bailout in early July (which, as we mentioned earlier, cost the government more than $1 trillion.) To fund this bailout, interbank lending by state-backed entities has surged, says Carlo Reiter, analyst at J Capital Research. In July, government institutions lent 9.3 trillion yuan to banks, mostly to boost the stock market, he says.

However, the flood of interbank capital eventually caught up with the PBoC. Adding even more money into the financial system put downward pressure on the yuan.

This brings us to the Aug. 11 currency devaluation, which likely occurred because the yuan became too “expensive to defend,” says Reiter. Nevertheless, the exchange rate has leveled off over the last few trading days—a sign that capital outflow is so great that the central bank has once again resorted to selling dollars for yuan.

Already, this “battle to stabilize the currency has had a significant tightening effect on domestic liquidity conditions,” wrote Wei Yao, economist at Societe Generale, in an Aug. 25 note. In other words, the government’s grand plans to reduce its debt woes while preventing capital from flowing out may have the perverse effect of causing more of both.

Related Posts

  • 74
    The price of iron ore has been crashing as well. It is down 35 percent in the last nine months, and David Stockman believes that this is because of a major deflationary crisis that is brewing in China… There is no better measure of the true contraction underway in China…
    Tags: china, crash, stock, economy
  • 67
    The fast food chain is targeting 700 poor performing restaurants for closing this year, according to a McDonald's news release in which it reported losses not only in the United States, but in Europe and Asian as well. First quarter comparable sales in the United States decreased 2.6 percent and…
    Tags: china, economy, crash
  • 65
    China's central bank reiterated its stance of continuing with a stable monetary policy this year and promising to contain risks in lending, noting that the economy has yet to find a stable base for growth. In its quarterly monetary policy report, released on Saturday, the People's Bank of China (PBOC)…
    Tags: bank, china, pboc, economy
  • 63
    The only thing we know for sure is that stock in Hanergy Thin Film Power, a solar panel company equipment owned by what was at the time China's richest man, fell 47 percent last Wednesday. We don't know exactly why it fell, or even how much its Chairman Li Hejun…
    Tags: stock, money, crash, china
  • 62
      When the banking crisis crippled global markets seven years ago, central bankers stepped in as lenders of last resort. Profligate private-sector loans were moved on to the public-sector balance sheet and vast money-printing gave the global economy room to heal. Time is now rapidly running out. From China to…
    Tags: market, economy, china, chinese, stock, currency, bank, crash

Oil producers need to find half a trillion dollars to repay debt.

At a time when the oil price is languishing at its lowest level in six years, producers need to find half a trillion dollars to repay debt. Some might not make it.

The number of oil and gas company bonds with yields of 10 percent or more, a sign of distress, tripled in the past year, leaving 168 firms in North America, Europe and Asia holding this debt, data compiled by Bloomberg show. The ratio of net debt to earnings is the highest in two decades.

If oil stays at about $40 a barrel, the shakeout could be profound, according toKimberley Wood, a partner for oil mergers and acquisitions at Norton Rose Fulbright LLP in London. West Texas Intermediate crude was up 4.5 percent to $40.32 a barrel at 10:51 a.m. in London.

“The look and shape of the oil industry would likely change over the next five to 10 years as companies emerge from this,” Wood said. “If oil prices stay at these levels, the number of bankruptcies and distress deals will undoubtedly increase.”

Debt repayments will increase for the rest of the decade, with $72 billion maturing this year, about $85 billion in 2016 and $129 billion in 2017, according to BMI Research. A total of about $550 billion in bonds and loans are due for repayment over the next five years.

U.S. drillers account for 20 percent of the debt due in 2015, Chinese companies rank second with 12 percent and U.K. producers represent 9 percent.

In the U.S., the number of bonds yielding greater than 10 percent has increased more than fourfold to 80 over the past year, according to data compiled by Bloomberg. Twenty-six European oil companies have bonds in that category, including Gulf Keystone Petroleum Ltd. and EnQuest Plc.

Pressure Builds

Gulf Keystone can “satisfy all its obligations to both its contractors and creditors” after authorities in Kurdistan, where the company operates, committed to making monthly payments for crude exports from September, Chief Financial Officer Sami Zouari said in an e-mail.

An EnQuest spokesman declined to comment.

Slumping crude prices are diminishing the value of oil reserves and reducing borrowing power, even as pressure builds to find replacement fields.

Some earnings metrics are already breaching the lows of the 2008 financial crisis. The profit margin for the 108-member MSCI World Energy Sector Index, which includes Exxon Mobil Corp. and Chevron Corp., is the lowest since at least 1995, the earliest for when data is available.

“There are several credits which simply won’t be able to refinance and extend maturities and they may need to raise additional equity,” said Eirik Rohmesmo, a credit analyst at Clarksons Platou Securities AS in Oslo. “The question is: would they be able to do that with debt at these levels?”

Credit Ratings

Some U.S. producers gained breathing space by leveraging their low-cost assets to raise funds earlier this year and repay debt, Goldman Sachs Group Inc. wrote in a Aug. 6 report. This helped companies shore up their capital and reduce debt-servicing costs.

That may no longer be an option because energy companies have been the worst performers in the past year among 10 industry groups in the MSCI World Index.

Credit-rating downgrades are putting additional strain on the ability of oil companies to raise money cheaply. Standard & Poor’s cut the rating of Eni SpA, Italy’s biggest oil company, in April, while Moody’s Investors Service downgraded Tullow Oil Plc’s debt in March.

Spokesmen for Eni and Tullow declined to comment.

The biggest companies, with global portfolios that span oil fields to refineries, will probably emerge largely intact from the slump, Norton Rose’s Wood said. Smaller players, dependent on fewer assets, could have problems, she said.

“Clearly, those companies with debt to pay will have one eye firmly on oil prices,” saidChristopher Haines, a senior oil and gas analyst at BMI in London. “With revenues collapsing and debt soon to mature, a growing number of companies may find themselves unable to meet repayment schedules.”

Related Posts

  • 45
    Submitted by James Stafford via OilPrice.com, With all the conspiracy theories surrounding OPEC’s November decision not cut production, is it really not just a case of simple economics? The U.S. shale boom has seen huge hype but the numbers speak for themselves and such overflowing optimism may have been unwarranted.…
    Tags: oil, will
  • 42
    October 22, 2014 Santiago, Chile The US government’s debt is getting close to reaching another round number—$18 trillion. It currently stands at more than $17.9 trillion. But what does that really mean? It’s such an abstract number that it’s hard to imagine it. Can you genuinely understand it beyond just…
    Tags: debt, $, year
  • 30
    Picking the best debt-ceiling explainer is a very subjective task. Do you like charts? Then you'll probably like to have the debt ceiling explained in one chart.  Do you like movies? This one will explain the debt ceiling in 90 seconds.  Do you like cheese from Denmark? Then you will probably like…
    Tags: debt, will

China’s Stunning Stock Market Moves in One Huge, Annotated Chart

Related Posts

  • 89
    The yuan will be able to trade as much as 2% on either side of a daily central bank reference rate, compared with the current 1%  
    Tags: china
  • 70
     A recent academic report on wealth inequality in China shows that the top one percent of households holds one-third of total assets, while the bottom fourth holds only one percent. The report, published by a research institute in Peking University, says the Gini coefficient, better known for its application in…
    Tags: china, china's
  • 69
    One reason for global market weakness is investors’ fears that emerging market economies may be heading for a broad crisis, sparked by higher U.S. interest rates and slowing growth in China. Much of the analysis in the last few days has focused on why these nations are less exposed to…
    Tags: market, china
  • 69
      Alexander Vurving from the Honolulu-based Asia-Pacific Center for Security Studies takes the Chinese board game of weiqi or Go to describe the country's grand strategy in the disputed South China Sea in an article written for the website of National Interest magazine on Dec. 8. Vurving said that while…
    Tags: china, china's
  • 67
    Foreign direct investment into China, a gauge of external confidence, slumped to a four-year low amid antitrust probes into multinational companies that have spurred a letter of complaint from the U.S. Inbound investment was $7.2 billion in August, down 14 percent from a year earlier, the Ministry of Commerce said…
    Tags: china

Are we heading into a bigger storm ?

CM77NGgWgAAby46

Related Posts

Eight signs a global market crash is imminent as central banks lose control


When the banking crisis crippled global markets seven years ago, central bankers stepped in as lenders of last resort. Profligate private-sector loans were moved on to the public-sector balance sheet and vast money-printing gave the global economy room to heal.

Time is now rapidly running out. From China to Brazil, the central banks have lost control and at the same time the global economy is grinding to a halt. It is only a matter of time before stock markets collapse under the weight of their lofty expectations and record valuations.

The FTSE 100 has now erased its gains for the year, but there are signs things could get a whole lot worse.

1. Chinese slowdown

China was the great saviour of the world economy in 2008. The launching of an unprecedented stimulus package sparked an infrastructure investment boom. The voracious demand for commodities to fuel its construction boom dragged along oil and resource-rich emerging markets.

The Chinese economy has now hit a brick wall. Economic growth has dipped below seven per cent for the first time in a quarter of a century, according to official data. That probably means the real economy is far weaker.

The People’s Bank of China has pursued several measures to boost the flagging economy. The rate of borrowing has been slashed during the past 12 months from six per cent to 4.85 per cent. Opting to devalue the currency was a last resort and signalled that the great era of Chinese growth is rapidly approaching its endgame.

Data for exports showed an 8.9 per cent slump in July from the same period a year before. Analysts expected exports to fall only 0.3 per cent, so this was a huge miss.

The Chinese housing market is also in a perilous state. House prices have fallen sharply after decades of steady growth. For the millions who stored their wealth in property, it makes for unsettling times.

2. Commodity collapse

The China slowdown has sent shock waves through commodity markets. The Bloomberg Global Commodity index, which tracks the prices of 22 commodities, fell to levels last seen at the beginning of this century.

The oil price is the purest barometer of world growth as it is the fuel that drives nearly all industry and production around the globe.

Brent crude, the global benchmark for oil, has begun falling once again after a brief rally earlier in the year. It is now hovering above multi-year lows at about US$50 per barrel.

Iron ore is an essential raw material needed to feed China’s steel mills, and as such is a good gauge of the construction boom.

The benchmark iron ore price has fallen to US$56 per tonne, less than half its US$140 per tonne level in January 2014.

3. Resource price crisis

Billions of dollars in loans were raised on global capital markets to fund new mines and oil exploration that was only ever profitable at previous elevated prices.

With oil and metals prices having collapsed, many of these projects are now loss-making. The loans raised to back the projects are now under water and investors may never see any returns.

Nowhere has this been felt more acutely than shale oil and gas drilling in the U.S. Tumbling oil prices have squeezed the finances of U.S. drillers. Two of the biggest issuers of junk bonds in the past five years, Chesapeake and California Resources, have seen the value of their bonds tumble as panic grips capital markets.

As more debt needs refinancing in future years, there is a risk the contagion will spread rapidly.

4. Dominoes falling

The great props to the world economy are now beginning to fall. China is going into reverse. And the emerging markets that consumed so many of our products are crippled by currency devaluation. The famed Brics of Brazil, Russia, India, China and South Africa, to whom the West was supposed to pass on the torch of economic growth, are in varying states of disarray.

The central banks are rapidly losing control. The Chinese stock market has already crashed and disaster was only averted by the government buying billions of shares. Stock markets in Greece are in turmoil as the economy grinds to a halt and the country flirts with ejection from the eurozone.

Earlier this year, investors flocked to the safe-haven currency of the Swiss franc but as a 1.1 trillion euro quantitative easing program devalued the euro, the Swiss central bank was forced to abandon its four-year peg to the euro.

5. Credit rollover

As central banks run out of silver bullets then, credit markets are desperately seeking to reprice risk. The London Interbank Offered Rate (Libor), a guide to how worried U.K. banks are about lending to each other, has been steadily rising during the past 12 months. Part of this process is a healthy return to normal pricing of risk after six years of extraordinary monetary stimulus. However, as the essential transmission systems of lending between banks begin to take the strain, it is quite possible that six years of reliance on central banks for funds has left the credit system unable to cope.

Credit investors are often far better at pricing risk than optimistic equity investors. In the U.S., while the S&P 500 continues to soar, the high-yield debt market has already begun to fall sharply.

6. Interest rate shock

Interest rates have been held at emergency lows in the UK and US for around six years. The U.S. is expected to move first, with rates starting to rise from today’s 0 to 0.25 per cent around the end of the year. Investors have already starting buying dollars in anticipation of a strengthening U.S. currency. U.K. rate rises are expected to follow shortly after.

7. Bull market record

The U.K. stock market is in its 77th month of a bull market, which began in March 2009. On only two other occasions in history has the market risen for longer. One is in the lead-up to the Great Crash in 1929 and the other before the bursting of the dotcom bubble in the early 2000s.

U.K. markets have been a beneficiary of the huge balance-sheet expansion in the U.S. US monetary base, a measure of notes and coins in circulation plus reserves held at the central bank, has more than quadrupled from around US$800 billion to more than US$4 trillion since 2008. The stock market has been a direct beneficiary of this money and will struggle now that QE3 has ended.

8. Overvalued U.S.

In the U.S., Professor Robert Shiller’s cyclically adjusted price earnings ratio — or Shiller CAPE — for the S&P 500 stands at 27.2, some 64 per cent above its historic average of 16.6. On only three occasions since 1882 has it been higher — in 1929, 2000 and 2007.

The Daily Telegraph

Related Posts

  • 70
      Source : http://www.alhambrapartners.com/2015/08/14/the-dollar-run-hits-the-corporate-bubble/ The ‘Dollar’ Run Hits The Corporate Bubble by Jeffrey P. Snider in Bonds, Currencies, Economy, Federal Reserve/Monetary Policy, Markets Tags:asian flu, asset bubbles, china, convertibility, corporate bond bubble, dollar run, eurodollar standard,global recession, high yield, interbank, junk, leveraged loans, Repo, wholesale funding, yuan By the behavior of…
    Tags: central, bank, banks, economy, crash
  • 66
    When stock markets are free-falling 10+% in a matter of days, it’s natural to seek some answers to the question “why now?” Some are saying it was all the result of high-frequency trading (HFT), while others point to China’s modest devaluation of its currency the renminbi (a.k.a. yuan) as the…
    Tags: china, global, growth, economy, markets, central, bank
  • 65
    (Source http://www.independent.co.uk/news/business/comment/david-blanchflower/david-blanchflower-we-should-fear-deflation--not-welcome-it-9986726.html ) The UK isn’t in deflation yet. While central bankers know what to do about stopping inflation, they don’t know what to do about halting deflation. The Swiss National Bank last week abandoned its attempt to defend a currency floor, which caused a sharp appreciation in its currency, which…
    Tags: cent, price, economy, bank, central
  • 64
    China's central bank is prepared to take its strongest action since 2012 to loosen monetary policy if economic growth slows further, by cutting the amount of cash that banks must keep as reserves, sources involved in internal policy discussions say. A cut would be triggered if growth slips below 7.5…
    Tags: bank, central, banks, cent, growth, currency, year, expected, fall, market
  • 62
    The world's next credit crunch could make 2008 look like a hiccup Is this why central bankers are so scared of raising interest rates?   A solar eclipse, a super moon, the FTSE 100 breaching 7,000 and the US Federal Reserve speaking in tongues - truly some kind of financial…
    Tags: markets, market, crash, bank, rate, price, stock, central, year, global

The ‘Dollar’ Run Hits The Corporate Bubble


Source : http://www.alhambrapartners.com/2015/08/14/the-dollar-run-hits-the-corporate-bubble/

The ‘Dollar’ Run Hits The Corporate Bubble

By the behavior of the Chinese yuan itself, given the financial size here, we can readily assume that any “dollar” problem that is clearly causing the PBOC’s actions are sizable. Currencies throughout Asia are being roiled not unlike 1997 and oil prices sunk to a new “recovery” low. While that all suggests far away turmoil relevant only to those foreign shores, there are many domestic and internal eurodollar problems that leave little doubt about unification and singularity. As I wrote this morning, there is only one currency war and that is the “dollar” as it implodes onto itself.

The spread of financial irregularity, including stumped and deviating central banks (the list only grows, PBOC the latest casualty), signals the decay that began on August 9, 2007, as it has accelerated since last year. Internal interbank rates have risen, especially lately, which is central to all this “dollar” turmoil. Repo rates surged in the past two weeks, and while the GC rate paused yesterday (MBS down only from 30.7 bps to 30.1 bps), it remains at a noticeably elevated station.

ABOOK Aug 2015 Run Repo GCABOOK Aug 2015 Run Repo GC QE Comp

With all that in mind, Jason Fraser of Ceredex Value Advisors alerted me to greater and certainly related turmoil in the less visible high yield spaces. The Bank of America/Merrill Lynch High Yield CCC Yield got absolutely slammed yesterday, rising from 13.58% to16.18%! That would suggest, as all listed above, that there has been inordinate and tremendous “dollar” pressure not in foreign, irrelevant locales but creeping into the contours of the domestic and internal framework. While that may be energy, as Jason points out, it cannot all be energy.

The surge there far surpassed the 2013 summer meltdown and actually equals the 2011 crisis crash.

ABOOK Aug 2015 Run BofAML HYs  CCC

In fact, other junk indicators were similarly taken out in a manner that we have seen before. The Bank of America/Merrill Lynch Master II yield was far less dramatic but still indicating a serious liquidity event in that risky space. As both yield indices make plain, the last time prices were so slammed was early to mid-December – right when the ruble was crashing and the franc/dollar problem was testing the Swiss National Bank’s last resolve.

ABOOK Aug 2015 Run BofAML HYs  Master II

December 16 also marked the low point in the S&P LSTA Leveraged Loan 100 Index. When last we left that part of the junk/risk market, it was selling off and only a few ticks above that December low. S&P has not updated its figures for the index since August 10, curiously going dark during all of this “dollar” turmoil. I emailed them directly for clarification, and the response I got was, “Just a lag in getting the data.”

I have no specific reason for doubting the sincerity of that reply and explanation, though I can’t help but note that it is awful curious that they would be having such pricing problems when the rest of their similarly situated class within the corporate bubble is as churning and possibly illiquid as the yuan. I cannot recall a similar lag in updating the index, but, again, I have no specific inside knowledge on their internal workings.

ABOOK Aug 2015 Leverage Lev Loan

The cumulative assessment of all these factors, great as they are in their individuality, is that the global financial system just endured this week another “dollar” run. We can say with some reasonable assurance there was one in early December, as well as one centered on October 15. They seem to be increasing in intensity and now reach, penetrating deeper into the bowels of the “dollar” system as well as taking down central banks with each successive wave.

As I wrote, again, this morning:

The higher currency fix signals that whatever great “dollar” run hit the China funding markets this week may have passed – even if only temporarily. In short, the actions of the PBOC, seen in light of what was a convertibility mini-crisis, a “run” of sorts, make sense where the yuan fix as some kind of “stimulus” in devaluation does not (or is at least far too inconsistent to be explanatory). The PBOC held the yuan steady to a near plateau for five months hoping for cessation of “dollar” pressure, but, like a coiled spring, it only intensified until there was no holding back anymore.

It will be interesting once S&P updates the leveraged loan index to see how much effect and maybe devastation was experienced there during this run. For now, it seems today as if the acuteness has abated and calm has been restored.

That does not mean, however, that all this is over; far from it. These tremors are warnings that the “dollar” system’s decay is reaching critical points. The mainstream will tender that this is really no big deal, just a tantrum of spoiled markets unwilling to easily treat the coming end of ZIRP and accommodation; that is simply and flat out false. There is a systemic liquidity problem that is and has been fatal, exposed to a greater degree by the continued withdrawal of eurodollar bank participation – the real “printing press.”

In a credit-based monetary system neither the economy nor its ultra-heavy financial component can move forward without ever-growing financialism; dark leverage and all that. There has been a continuous withdrawal dating back to, again, August 2007, but met with amplifications first in 2011, again in the middle of 2013 and then last year. This is not policy but a total systemic reset, as “money dealing” activities have never been settled this entire time. The dealer network simply withdrew starting in August 2007 with central bank balance sheets taking up the slack, belatedly as usual which is why there was a panic and crash. Dealers are again removing what little presence they have left but central banks seem totally unaware that that is the case, and that there is really nothing left for “money” intermediation upon that and their withdrawal.

I wrote back in May upon this very topic, as some very good and smart people, Perry Mehrling and Zoltan Pozsar, were attempting to gameplan the coming monetary shift. My view hasn’t changed, namely that the transition will not be a transition at all, but a potentially awaiting systemic decapitation:

I personally find way too much complacency in blindly believing that going from B to C will be only a minor inconvenience. It would be dangerous even under the circumstances where the system shifted from the dealers to the Fed and back to the dealers, with an infinite series of potential dangers even there. But to undertake a total and complete money market reformation from dealers to the Fed to money funds? There are no tests or history with which to suggest this is even doable under current intentions. Poszar and Mehrling’s contributions more than suggest that difficulty, but I think that still understates whether or not we ever get that far.

This latest “dollar” episode has continued to bear that out. How much further will it go before central banks wake up and see that their fantasy of a recovery and “resilient” financial system was a now-eight year old lie? That is, of course, a rhetorical question as they will not act until all is over. That is the problem, because this hollowed-out global “dollar” is supporting, badly, the main bubble, so the penetration into the corporate space is a highly unwelcome development (though welcome in the long run sense of actual and helpful balance) as this remains awaiting resolution upon increasingly unstable circumstances:

ABOOK June 2015 Bubble Risk Subprime to Junk Lev Loans CLOsABOOK June 2015 Bubble Risk Eurodollar Standard2

Related Posts

  • 78
    We get some strong deflation signs in USA last 3 months, economic numbers not too good only thing rising is debt and consumer confidence.  
    Tags: economy, crash
  • 76
    Coal accounts for approximately 40 percent of all electrical generation on the entire planet.  When the price of coal starts to drop, that is a sign that economic activity is slowing down. Just prior to the last financial crisis in 2008, the price of coal shot up dramatically and then…
    Tags: financial, crash, economy
  • 74
    The price of iron ore has been crashing as well. It is down 35 percent in the last nine months, and David Stockman believes that this is because of a major deflationary crisis that is brewing in China… There is no better measure of the true contraction underway in China…
    Tags: will, crash, economy
  • 70
      When the banking crisis crippled global markets seven years ago, central bankers stepped in as lenders of last resort. Profligate private-sector loans were moved on to the public-sector balance sheet and vast money-printing gave the global economy room to heal. Time is now rapidly running out. From China to…
    Tags: economy, central, banks, bank, crash
  • 69
    Half of the 41 fracking companies drilling for shale oil and gas in the US will be dead or sold by year-end amid steep crude price declines, Bloomberg reports.  An executive with Weatherford International Plc said slashed spending by oil companies has put much of the US fracking industry at risk.…
    Tags: will, crash, economy

Q&A: China’s currency devaluation

China’s central bank weakened the renminbi by its most in two decades on Tuesday. The unexpected move fuelled talk of “currency wars”, although some interpreted it as a welcome gesture towards market reform and financial liberalisation.

What happened?

The People’s Bank of China devalued its currency by setting the daily “fix” for the renminbi 1.9 per cent lower — the sharpest shift on record. The move caused investors to push the currency to its lowest level in nearly three years.

What’s the daily fix?

Each day at 9.15am in Beijing the PBoC sets a midpoint for its tightly controlled currency. When the market opens 15 minutes later investors are allowed to trade the currency 2 per cent either way from this midpoint.

Why now?

An obvious catalyst is the slowing economy: in the first and second quarters China’s economy grew at an annual rate of 7 per cent, the slowest pace in six years. Data at the weekend showed exports tumbled 8.3 per cent year-on-year in July, far worse than expectations for a 1.5 per cent decline. A weaker currency should help make Chinese exports competitive.

So China is trying to spur exports? Isn’t that a currency war?

Not necessarily. The stated purpose for the move was market reform. The central bank said this was a one-time move to enhance “the market-orientation and benchmark status” of the renminbi. Previously, the PBoC would set the currency wherever it liked. Now it will give markets a voice: the daily fix will “refer to the closing rate of the interbank foreign exchange market on the previous day”.

Is there pressure for market reform?

Before the end of the year the International Monetary Fund will decide whether to include the renminbi in its special drawing rights, a global reserve asset comprising the dollar, euro, pound and yen. Inclusion would mean endorsing the renminbi as a formal reserve currency.

Last week the IMF hailed China’s progress on financial reform but called on authorities to take further steps to increase foreign access to its onshore stock and bond markets. The IMF only conducts a review of the SDR once every five years, so the PBoC could be stepping up its efforts to liberalise the currency as part of its quest to internationalise use of the renminbi.

So this is a triumph for market reform?

Perhaps, but it is hard to say. The renminbi had been under pressure to weaken for months because of capital outflows but the PBoC restrained any depreciation by setting the fix higher and selling forex reserves. Today’s one-off depreciation eases some of that pressure.

Many economists were optimistic about the action. Those at Barclays called the new mechanism “a revolutionary move”. But we will not know if China is truly letting the market have a say in the currency’s value until we have seen it move in a direction that would not be supportive to its own goals.

The Chinese currency has a soft peg to the US dollar, which has surged this year and contributed to the decline in Chinese exports. A weaker renminbi could support the economy, so Beijing could simply be allowing the currency to slide and use the talk of “market reform” as political cover; otherwise it would be controversial for the currency to be devalued.

Does this matter outside of China?

Yes. China is a huge consumer of commodities and if the move is interpreted as a sign of economic weakness, there will be ripple effects. On Tuesday every currency in the region weakened against the US dollar — those of New Zealand, Taiwan, South Korea, Singapore and Australia fell by 1 per cent or more.

Dollar strength could make the Federal Reserve reluctant to lift interest rates, as that would cause further upward pressure on the US currency.

Within China, the nation’s airlines lost 9 per cent of their market value, on average, as a weaker renminbi will inflate the cost of oil, priced in US dollars. The same effect forced shares of Qantas, Australia’s flagship carrier, to fall as much as 4.1 per cent.

What are the risks?

Investors have been pushing for the renminbi to weaken and if they are allowed to determine where the fix is, it’s possible the currency could depreciate quickly. Stuart Allsopp, head of country risk at BMI Research, a unit of Fitch, warns that investors could now see the renminbi as a one-way bet “and start to position against the currency, raising the prospect of more substantial [renminbi] weakness and more economic uncertainty”.

What now?

The key question is whether Beijing really does allow the currency to trade more freely. Last year the PBoC moved to stomp out one-way speculation, when the renminbi was continually appreciating, resulting in the currency’s first annual loss in two decades. If investors begin to push the renminbi lower, Beijing may feel the need to act again. If it does not, neighbouring countries that compete for exports may complain.

The US could be a tough position: it has asked for market reform for years but if China allows the daily fix to be determined by market forces and the currency depreciates, hurting US manufacturers, it is not obvious how Washington should respond.


Related Posts