Category Archives: Trading

2016 macro outlook

Related Posts

The optimal portfolio of risky assets is exactly the same for everyone

The optimal portfolio of risky assets is exactly the same for everyone :

1. Investors should control the risk of their portfolio not by reallocating among risky assets, but through the split between risky and risk-free assets.

2. The portfolio of risky assets should contain a large number of assets – it should be a well diversified portfolio.

Related Posts

  • 86
    https://www.youtube.com/watch?v=ZWz_Pln_uuI
    Tags: trading
  • 83
    http://www.swfinstitute.org/fund-rankings/
    Tags: trading
  • 82
    Forex: 10 Events to Watch Next Week In order of release 1. UK Consumer Price Index (Aug 19) 2. New Zealand Dairy Auction (Aug 19) 3. RBA Semi-Annual Testimony (Aug 19) 4. Bank of England Minutes (Aug 20) 5. FOMC Minutes (Aug 20) 6. HSBC China Manufacturing PMI Aug Flash…
    Tags: trading
  • 80
    This paper considers an asset market where investors have private information not only about asset payoffs, but also about their own exposure to an aggregate risk factor. In equilibrium, rational investors disagree about asset payoffs: Those with higher exposure to the risk factor are (endogenously) more optimistic about claims on…
    Tags: risk, investors, trading
  • 80
    There is a reason why I recommend everyone download (and read) this document. Not only is it free but it provides both novice and experienced investors with some perspective on some very basic issues. For example, the next time some one says you should divest your portfolio of so-called “sin…
    Tags: portfolio, investors, trading

10%= correction, 20%= bear market.

( Source : https://theirrelevantinvestor.wordpress.com/2016/01/12/probably-everything-you-need-to-know-about-bear-markets/ )

stock-market-correction

10%= correction, 20%= bear market.

I know these arbitrary numbers sometimes seem silly, but when looking at the data, you have to draw the line somewhere. Get over it, let’s move on.

The S&P 500 has been in a drawdown for the last eight months. Stocks are currently 9.2% below the highs made in May 2015, just a hair away from official correction territory. Everyone knows this is totally normal, but you might be surprised to know that since 1928, stocks have been in a 10% drawdown 55% of the time. The problem of course is that they never feel normal because we don’t know in real time if this is just a correction or the start of a bear market. And the deeper stocks go, the harder it is to resist fear’s temptation.

In times like this, historical facts don’t provide much comfort and even less of a roadmap, however, hopefully they can provide a little context.

Since 1928, there have been fifteen separate drawdowns of 10%. Before I continue, you might be thinking, “only fifteen corrections, that doesn’t sound right.” Here’s how I look at drawdowns; in my mind, a drawdown is not over until new highs are made. Of these fifteen corrections, ten have turned into a bear market.

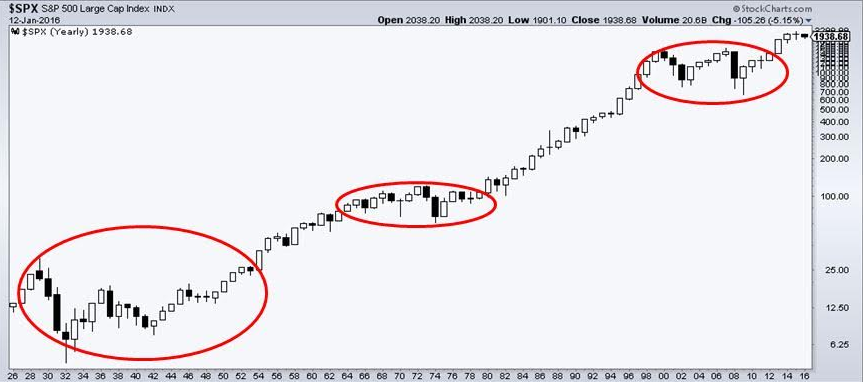
Let’s take a closer examination of these 20% declines because not all bear markets are created equal. There are secular bear markets, which by their nature can only be defined after the fact. These are long periods of time in which stocks make little progress. Then there are cyclical bears, which can come in the middle of a long secular bear or even a secular bull. The chart below shows the three secular bears over the last ninety years.

Screen Shot 2016-01-12 at 8.36.44 PM

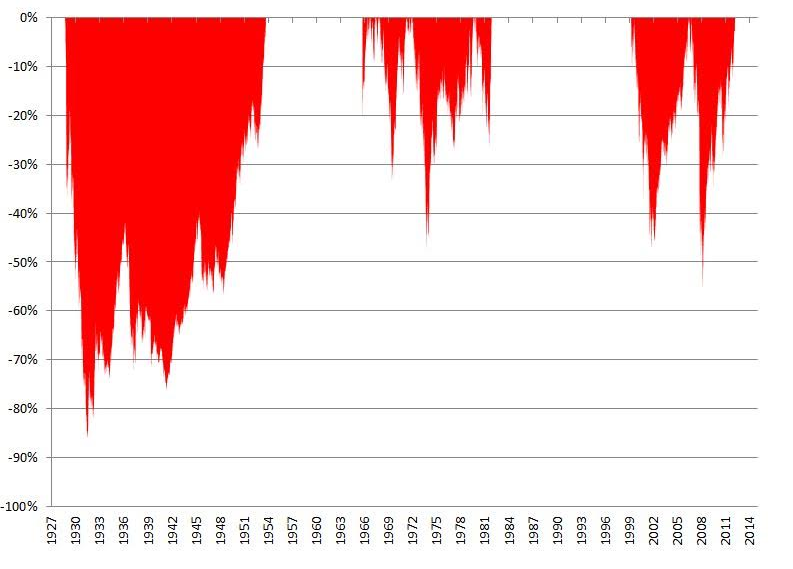
As you can see, the defining characteristic for secular bears is that stocks make no progress for long periods of time. Even worse, they experience severe declines which can scar an entire generation of investors. The chart below shows the painful drawdowns investors witness during these secular bear markets.

Screen Shot 2016-01-12 at 8.37.59 PM

The frustrating thing about each and every bear is it’s impossible to know how long they will last. Think about the most recent secular bear, which lasted from March 2000 through March 2013 (I think it’s over, though reasonable people can disagree on this). Stocks briefly poked their heads above their 2000 highs in October 2007 before being slammed right back into their decade long range. Investors had a similar experience in 1980; break above the long range for a minute only to be delivered one final gut punch.

Screen Shot 2016-01-12 at 8.38.28 PM

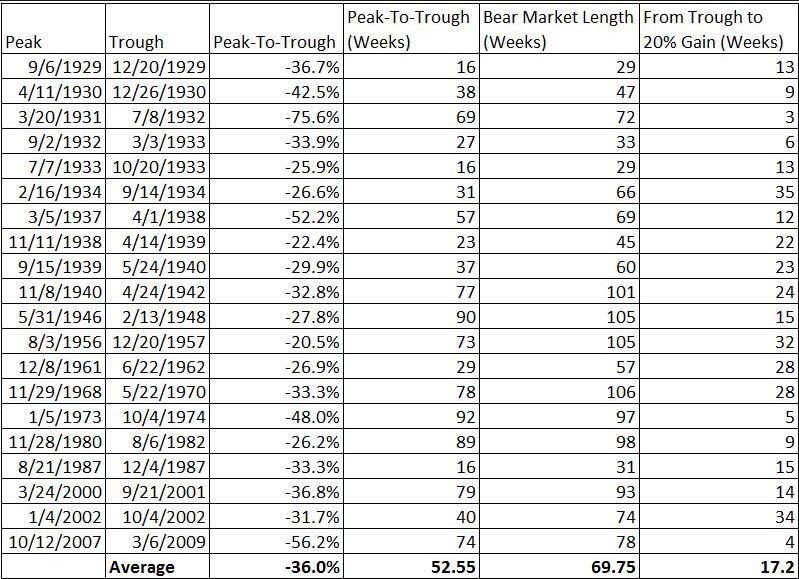
Looking at bear markets over long periods of time might not be as helpful as breaking them down further. Within the three secular bears have been distinct cyclical bears (think the tech bubble of 2000 and credit bubble of 2007). Here is how I’ve compiled the data below; any time there is a 20% rally, the bear market is over. What this does is break up 1929-1954 period into 11 separate bear markets.

The average of these 20 distinct bear markets saw a 36% peak-to-trough decline, lasting just over 52 weeks. The fifth column shows how long each bear was and the the sixth column shows how quickly stocks gained 20% from their lows, resetting the bear market. For instance, the October ’07 peak to the March ’09 lows was 74 weeks. Stocks then rallied 20% in 4 weeks, making 78 weeks the total length of that particular bear market.

Screen Shot 2016-01-12 at 8.38.13 PM

Whether the S&P 500 sees a correction, and whether or not that turns into a bear market, and how deep it might go and how long it might last is anybody’s guess. The only thing in your control is what you choose to do or not do. Making decisions in the heat of the moment is almost never a good idea, which is why having a plan in place is so important. Knowing that you have an answer, whether stocks go up, down or sideways a is really liberating feeling.

Related Posts

  • 72
    https://www.youtube.com/watch?v=ZWz_Pln_uuI
    Tags: trading
  • 71
    There is a reason why I recommend everyone download (and read) this document. Not only is it free but it provides both novice and experienced investors with some perspective on some very basic issues. For example, the next time some one says you should divest your portfolio of so-called “sin…
    Tags: time, stocks, trading
  • 71
    Embarking on a trading adventure involves developing a systematic strategy, understanding trend following, and mastering risk management. Drawing on resources like Covel's "Trend Following" and Schwager's "Market Wizards," traders must cultivate patience and discipline. Continual learning and adaptation are crucial to navigating the ever-changing markets and achieving long-term success.
    Tags: trading, market
  • 70
    http://www.swfinstitute.org/fund-rankings/
    Tags: trading
  • 70
    1. The only leading indicator that matters Watch the market leaders, the stocks that have led the charge upward in a bull market. That is where the action is and where the money is to be made. As the leaders go, so goes the entire market. If you cannot make money in…
    Tags: market, stocks, time, trading

In the stock market, short term trends are mostly random and heavily influenced by luck

(Source :  http://jimoshaughnessy.tumblr.com/post/137235375474/short-term-luck-versus-long-term-skill )

Daniel Kahneman, one of the fathers of behavior economics, said one of his favorite papers was “On the Psychology of Prediction (1973).” He claims in the paper that intuitive predictions are often unreliable because people base their predictions on how well an event fits a story. In behavioral economics, this phenomena is called a judgmental heuristic—representativeness, or how familiar you are personally with the story. This is one of the worst ways to make a forecast, because it uses a highly limited data set and allows the law of small numbers to mislead you and your forecast. For example, one study showed that when a doctor is told that a procedure works 50 percent of the time (essentially a coin toss probability or base rate) he or she could get the majority of patients to undergo the procedure if he or she simply added “The last patient who did this is doing great!” The story of success eliminates consideration of the base rate.

I recommend that to successfully make predictions about the long-term results of something such as an investment strategy or the overall direction of a market, you must consider three things:

1.      The long-term base rate of the success or failure of the strategy you are evaluating;

2.      The tendency of systems where both luck and skill are involved to revert to the mean and;

3.      What happened historically after certain extreme observations.

So, for example, when I wrote the commentary entitled “A Generational Buying Opportunity” in March of 2009, I was not relying on any particular insight that I might have had at the time, but rather on the data available to me about what happens in markets after they reach an extreme infection point.  It’s important to remember that the stock market is a complex, adaptive system with feedback loops that has elements of both luck and skill. Luck, in the stock market, essentially holds sway over the short-term and is a specific chance occurrence that affects the overall market or individual stock or portfolio can be either good or bad. Luck is a residual—it’s what is left over after you subtract skill from the outcome.

How much luck is involved determines the range of outcomes—where little luck is involved, a good process will almost always lead to a good outcome. Where a measure of luck is involved, a good process will usually have a good outcome, but only over longer periods of time. The luck/skill continuum in investing is almost entirely a function of time. Over shorter periods, your results are highly contingent on luck and chance. This is vital to understand because you might see a bad process provide excellent results due entirely to chance and a good process provide poor results for the same reason.

Consider a simple intuitive strategy of buying the 50 stocks with the best annual sales gains. But consider this not in the abstract but in the context of what had happened in the previous five years:

Year                            Annual Return            S&P 500 return

Year one                      7.90%                          16.48%

Year two                     32.20%                        12.45%

Year three                   -5.95%                         -10.06%

Year four                     107.37%                      23.98%

Year five                     20.37%                        11.06%

Five-year

Average Annual

Return                         27.34%                        10.16%

$10,000 invested in the strategy grew to $33,482 dwarfing the same investment in the S&P 500, which grew to $16,220. The three-year return (which is the metric that almost all investors look at when deciding if they want to invest or not) was even more compelling, with the strategy returning an average annual return of 32.90% compared to just 7.39% for the S&P 5000. Also consider that these returns would not appear in a vacuum—if it was a fund it would probably have a five start Morningstar rating; it would probably be featured in business news stories quite favorably and the “long-term” proof would say that this intuitive strategy made a great deal of sense and would attract a lot of investors.

Here’s the catch—the returns shown are from “What Works on Wall Street” and are for the period from 1964 through 1968, when, much like the late 1990s, speculative stocks soared. Investors without access to the very long-term results to this investment strategy would not have the perspective that the longer term brings, and without these tools, might have jumped into this strategy right before it went on to crash and burn. As the data from What Works on Wall Street makes plain, over the very long term, this is a horrible strategy that returns less then U.S. T-bills over the long-term. Had this investor had access to long-term returns, he or she would have seen that buying stocks based just on their annual growth of sales was a horrible way to invest—the strategy returned just 3.88 percent per year between 1964 and 2009! $10,000 invested in the 50 stocks from All Stocks with the best annual sales growth grew to just $57,631 at the end of 2009, whereas the same $10,000 invested in U.S. T-Bills compounded at 5.57 percent per year, turning $10,0000 into $120,778. In contrast, if the investor had simply put the money in an index like the S&P 500, the $10,000 would have earned 9.46 percent per year, with the $10,000 growing to $639,144! An investment in All Stocks would have done significantly better, earning 11.22 percent per year and turning the $10,000 into $1.33 million! What the investor would have missed during the phase of exciting performance for this strategy is that, in the end, valuation matters, a lot.

This is a good example of why Kahneman’s paper is so important—people make forecasts not on the data, but how well the prediction fits their perspective and the story behind it. Extrapolating from a small data set can be disastrous to long-term results. The “Most Dangerous Equation” was derived by Abraham de Moivre and states that the variation of the mean is inversely proportional to the size of the sample. A small sample tells you nothing about the true direction of results. Using a small sample—as we see above—can lead to costly errors over the long term.

What this tells us


1.      Investors are well advised to look at short-term performance as a worthless indicator for what will happen over the long-term. Indeed, short-term performance can be among the most misleading to investors and should be heavily discounted. The stock market combines both luck and skill, with luck more pronounced over short time periods, and skill more telling over long periods of time.

2.      Investors should make decisions using the long-term base rates a strategy exhibits—in other words, they should concentrate on what is probable rather than what is possible. If you organized your life around things that might possibly happen to you, you’d probably never leave your house, and when you did, it would only be to buy a lottery ticket. Consider, on a drive to the supermarket, it is highly probable that you will get there, buy your groceries and get back home to unpack them without incident. But what’s possible? Almost anything—it’s possible a plane flying overhead could lose an engine falling directly on your car and instantly killing you. It’s possible another car runs a red light and kills you on impact. It’s possible that you get carjacked and your assailant kills you in the process. You get the point—anything is possible but highly improbable. It’s only when you think in terms of probability that you will get in your car and go, yet few investors do so when making investment decisions. Our brains create cause and effect narratives after something has occurred that seem to make sense, however improbable the event. Witness anyone who invested in the stocks with the highest sales gains after a great short-term run.

3.      In the stock market, short term trends are mostly random and heavily influenced by luck. To succeed, you must ignore them and invest in strategies that have the highest probability (base rate) of succeeding in the future.

4.      You will not win the lottery. Avoid buying tickets and avoid what my son, Patrick O’Shaughnessy, calls lottery stocks.

5.      Over short periods of time, a good investment strategy can lead to poor results just as a poor investment strategy can lead to good results. Do your homework; understand how a strategy performs over long periods of time and stick with it. If you can do just this one thing, you will be ahead of the vast majority of investors over the long-term.

Related Posts

  • 55
    1. The only leading indicator that matters Watch the market leaders, the stocks that have led the charge upward in a bull market. That is where the action is and where the money is to be made. As the leaders go, so goes the entire market. If you cannot make money in…
    Tags: market, will, stock, stocks, time, trading
  • 54
    George Soros is 84 today. His career is remarkable both for its longevity and its returns – his Quantum fund has generated $39.6 billion in profits over the last four decades, making Soros the most successful hedge fund manager in history. How has Soros managed to stay at the top for so long?…
    Tags: returns, short, $, long, investors, year, trading
  • 53
    Embarking on a trading adventure involves developing a systematic strategy, understanding trend following, and mastering risk management. Drawing on resources like Covel's "Trend Following" and Schwager's "Market Wizards," traders must cultivate patience and discipline. Continual learning and adaptation are crucial to navigating the ever-changing markets and achieving long-term success.
    Tags: trading, market, strategy
  • 52
    Enhancing your trading approach requires strategic discipline and a commitment to certain principles that guard against common pitfalls. Here are six ways to level up your trading, ensuring that you maximize gains while minimizing losses: 1. No Big Losses (Cut Losses Quickly) Implement a strict stop-loss policy to protect your…
    Tags: trading, stocks, strategy, short, returns, consider, market, stock
  • 52
    While the setup is undeniably important, it's the process that often holds the key to resolving trading problems and unlocking the full potential of any trading strategy. A focus on developing, refining, and adapting the trading process can empower traders to achieve consistent success, even in the face of imperfect…
    Tags: process, trading, strategy, market

No surprise, a lot of unicorns are actually donkeys.

5c624dbc5bc6cb70e5e3c670862a9e23

( Source : https://medium.com/@abhasvc/unicorns-vs-donkeys-your-handy-guide-to-distinguishing-who-s-who-f1b30942b2b6 )

I’ve been having this conversation a lot lately:

Friend: “Did you see [startup] just raised at a $1B valuation?”
Me: “Unbelievable.”
Friend: “They’re apparently killing it on [metric that is meaningless without the bigger picture].”
Me: “Yeah, but their [metric that also matters] is struggling.”

I am by no means the unicorn prophet, but here’s how I think about which companies have earned their unicorn status vs. which ones are playing a dangerous game of massive capital needs, sky high valuations, impossible expectations, and deferred judgement days. Hopefully, by the end of this post, you’ll have an intuitive feel for which startups actually have a shot at being unicorns and which ones are probably just donkeys.

The Fundamental Law of Growth

LTV = Lifetime Value of a Customer; CAC = Cost of Acquiring a Customer

Like Newton’s laws of gravity or momentum, most tech startups (see exceptions below*) who sell directly to their customers — both enterprises and consumers — must eventually obey the Fundamental Law of Growth: LTV/CAC > 3. There’s a lot of nuance as to why — a discussion that is better suited for a semester-long class than a blog post — but suffice to say that the LTV/CAC ratio speaks to a startup’s revenue trajectory, capital needs, and in turn, how much “irrational exuberance” is demanded of its investors. The lower the LTV/CAC ratio, the less efficient a company is at deploying capital and the more money it needs to fuel growth; conversely, the higher the LTV/CAC ratio, the more efficient the company is and thus the more value it creates for the same amount of capital. Though this can be derived, many before me have empirically observed that 3x is roughly the threshold needed to build big, sustainable businesses.

Assessing a company’s valuation is a discipline on its own and growth is only one factor in that calculation. However, for simplicity’s sake, one can assume that tech companies who don’t obey the Fundamental Law of Growth will eventually lose access to capital, drastically slow their growth, and watch their valuations plummet — those fabled unicorns will eventually emerge as donkeys. So with that, let’s dig into some examples…

*Companies whose value is not predicated on revenue (e.g., disruptive technologies, monopolies, social networks, intellectual property) as well as companies where revenue is achieved indirectly (e.g., ad-tech networks, certain marketplaces, certain viral growth startups) or discontinuously (e.g., government contractors) typically do not follow this rule


For each example, I’ll make assumptions about the various components of the LTV/CAC ratio (see below); some assumptions are based on publicly available data and others are just gut feels. If it’s the latter, I’ve generally erred on being generous to the startups.

ARPU = Average Revenue Per User

Case Example #1: HelloFresh, Subscriptions Meals

  • Customer Lifetime — in my household, we usually try each meal subscription company for a few weeks then switch it up, but let’s assume the average across all customers is 3 months or 0.25 years
  • ARPU — average revenue is probably 2 people, 3 meals per week, 3 weeks per month, so $60/week x 3 = $180/month or $2160/year
  • Margin % — we know from Mahesh’s excellent IPO filing teardown that their margin is 52% (sign of a strong operating team; that’s higher than I expected for this type of business!)
  • CAC — given the numerous other meal subscription companies, brick and mortar competitors, etc., it feels like the CAC is probably in the hundreds, say $400
LTV/CAC = 0.25 years x $2160/year x 52% / $400 = 0.70x

Under these assumptions, HelloFresh is an incredibly capital intensive company because of the (presumed) low customer lifetime/high churn. We know from the IPO filing that HelloFresh grew its revenue from $77M in 2014 to $290M in 2015 (276% growth), so you can understand why someone would say, “They’re killing it on revenue!”. We also know that the company didn’t report cohort retention data, but as per Mahesh, “they do mention that they achieve 2.8x LTV/CAC after two years.” Hold up, come again?Reporting LTV/CAC for only a subset of customers is disconcerting, and even then, it’s just under 3x; substituting 2 years into the LTV/CAC ratio suggests that the true CAC may be much higher ($800). Other food subscription and even some on-demand meal companies — Blue Apron, Plated, Instacart, Munchery, Sprig, etc. — may similarly have short customer lifetimes/high churn and thus low LTV/CAC ratios, thereby also violating the Fundamental Law of Growth.

Verdict: Donkey Watch

Case Example #2: Evernote, Productivity Software

  • Customer Lifetime — I use Evernote constantly, so I expect if anyone is going to have an extended lifetime, it’s them. But as a rule of thumb, lifetimes >3 years should only be considered in exceptional circumstances
  • ARPU — in most freemium products, paid customers make up only a tiny fraction (<5%). Nevertheless, let’s assume 25% are premium users at $50/year, so a blended ARPU of .25 x $50 = $12.50
  • Margin % — pure SaaS company with no customer service costs should probably achieve 70–90% margins, so let’s go with 90%
  • CAC — freemium models typically land in the $1–$100 CAC range, so let’s assume $20
LTV/CAC = 3 years x $12.50/year x 90% / $20 = 1.69x

Evernote has great customer lifetimes, margins, and low CACs; however, because their pricing is low, their overall LTV is limited and thus results in a low LTV/CAC ratio, again violating the Fundamental Law of Growth. Evernote could compensate by increasing pricing, but with other readily available substitutes (Google Docs, Microsoft OneNote), increased pricing likely increases churn too, so the pressure is on Evernote to then increase ARPU by increasing value (additional products, collaboration tools, AI insights, etc.).

Verdict: Donkey Watch

Case Example #3: Oscar, Health Insurance

  • Customer Lifetime — once you join an insurer, you typically stay with them until you switch jobs/get a job. <1.5 years is probably the average, but let’s use 2 conservatively
  • ARPU — $5000; saw this in an Oscar press release and it’s fairly typical of this market
  • Margin % — healthcare insurers have gross margins in the 5–10% range with a max of 15% as mandated by Obamacare, so let’s go with 15%
  • CAC — this is an expensive product for consumers to purchase and probably requires a light-touch inside sales team, so let’s assume CAC is $800
LTV/CAC = 2 years x $5000/year x 15% / $800 = 1.88x

Similar to HelloFresh, Oscar is posting massive revenue ($200M) and growth rates (135%), so you can again understand the hype around them; however, Oscar fails the Fundamental Law of Growth due to its low gross margins. If the Oscar team can achieve a CAC near $500 — perhaps because they’re the hip/fresh insurer on the block with best-in-class marketing — then maybe the company can still grow a horn, but that’s asking a lot given the inherent complexity and cost of the product. Recently, a number of other companies— Jet.com, Instacart, etc.— have built fast-growing businesses that operate on low margins, but they too are at risk of breaching the Fundamental Law of Growth.

Verdict: Donkey Watch

Case Example #4: ZocDoc, Online Physician Reservations

  • Customer Lifetime—I’ve heard that physicians typically churn after a year once they’ve established a sizable patient base, but let’s assume 2 years
  • ARPU — $3000 (publicly available)
  • Margin % — SaaS company with light-touch customer service should probably achieve 60–80% margins, so let’s assume 80%
  • CAC — Selling to physician practices must be challenging, so like any high-touch inside sales operation, ZocDoc’s CAC is probably in the $1–10K range; let’s assume $3K
LTV/CAC = 2 years x $3000/year x 80% / $3000 = 1.60x

ZocDoc has a good LTV overall, but their CAC is likely a show-stopper. Unfortunately, there’s no getting around that — selling to physicians is tough stuff, just ask Pfizer. Also, as competition increases, customer lifetimes and pricing erode too, further driving down the LTV/CAC ratio. I suspect this is why ZocDoc is shifting sales to hospital system customers (1000x higher LTV and only 20x higher CAC), but hard to know what fraction of their business this constitutes. Although I am not familiar enough with the unit economics of fantasy sports startups, I suspect that FanDuel and DraftKings may similarly be spending heavily on customer acquisition without the supporting customer lifetimes or ARPU needed to satisfy the Fundamental Law of Growth.

Verdict: Donkey Watch


Concluding Thoughts

I hope this framework gives you a better sense of how to evaluate today’s unicorn landscape. The companies above all have impressive, press grabbing growth metrics, but they also fail the Fundamental Law of Growth for different reasons — short customer lifetime, low pricing, low margin, and high CAC — so must be viewed with some skepticism.

The most obvious next question is: if the Fundamental Law of Growth is so simple, why did investors grant $B valuations to these companies and others in the first place? I believe the answer is a combination of downside protections, upside overoptimism, and what can only be described as FOMO.

Downside protections are being prominently discussed now in light of Square’s down round IPO (albeit still in unicorn territory); to put it simply, late stage investors have (smartly) insulated themselves from losses, so they’re willing to give more on valuations. With regards to upside overoptimism, I imagine that when these rounds were executed, both investors and entrepreneurs believed that things would look up — customer lifetimes would extend, ARPU would increase, margins would expand, and CACs would decline. Alas, it doesn’t always pan out that way, which is why we encourage our portfolio companies to stay conservative on valuations: big up rounds can be appealing in the short-term, but when companies stumble (which they often do), the subsequent down rounds can be outright devastating. Zenefits, for example, is likely to feel that pain shortly given their recently exposed stumbles.

Personally, I’m looking forward to a private market correction. I feel my colleagues and I have done a good job building a portfolio of companies with sound fundamentals and well-earned valuations; a return to sanity would be a welcomed change, as it would unlock quality talent that we can then direct to our companies and others who are playing the prudent, long game.

China runaway train ?

David Dredge of global hedge fund Fortress has built a career studying, predicting and protecting against the world’s major financial crises. The recent convulsions in global sharemarkets are “just the beginning” of a painful adjustment as money drains from the emerging market economies, he says.

“August 2015 will go down in the record books, much like July 2007 or July 1997, as the beginning of the coming contractionary cycle,” says Dredge who is the co-chief investment officer of Fortress Convex Asia Fund.

August 2015 will go down in the record books, much like July 2007 or July 1997, as the beginning of the coming contractionary cycle.

David Dredge, Fortress

He’s a believer that markets move in long cycles, which “despite all efforts to the contrary, central bankers have not by any means gotten anywhere close to eliminating”.

Hedge fund Fortress says all emerging economies are in the midst of a painful adjustment after a "burst of credit expansion".Hedge fund Fortress says all emerging economies are in the midst of a painful adjustment after a “burst of credit expansion”. Photo: AP

“Like weathermen have not eliminated seasons,” he says.

Singapore-based Dredge says the current volatility in financial markets is in the early stage as markets react to a correction of global imbalances that will last from18 months to three years.

The global economy is made up of nations with a deficit of capital – the West – and those with a surplus of capital – the East and emerging markets, he explains.

Policy determined by deficit

“The flaw is that those with the surplus have all tied their currency to the main protagonist on the deficit side – the US.

“So monetary policy is determined by the deficit of capital side and flows through the currency linkage, and you end up having some form or another of the same monetary policy on both sides, with economies that are 180 degrees diametric to each other.”

The financial links to easy-money policies in the US have unleashed a burst of credit expansion in emerging markets that has proved unsustainable and is now in the process of unwinding.

That is forcing a painful “market-induced tightening” that will affect  the growth of emerging markets as credit expansion is halted and reverses.

The “simplest measure of these imbalances” is foreign exchange reserves, which have swelled in the past few years but are now being liquidated, tightening financial conditions in emerging markets.

“When the hose is on and credit is pouring from the deficit to the surplus side, the FX [foreign exchange] reserves increase and are indicative of the growing size and the location as to where the imbalances exist – because that’s where the most money is going.”

China’s foreign currency reserves peaked at $US4 trillion ($5.7 trillion) in mid-2014 but have since run down to about $US3.6 trillion.

‘In the inverse of imbalance’

“Each crisis occurred at the peak of FX reserves. The emerging-market FX-reserves graph looks exactly like the US debt to GDP because they are just in the inverse of the imbalance.”

Dredge says that differentiating among emerging economies misses the point of what is occurring. Capital is draining from the emerging markets as conditions have tightened, and has been since the “taper tantrum” of May 2013.

“In December 1999 the point wasn’t whether you should invest in Apple or Microsoft. The point was they were both going down [as the tech bubble deflated]. And that’s where we are now.

“The [credit] contraction might be triggered in China with retail margin lending in the equity market, or in Malaysia with recognition of corruption.

“But the trigger is not what we are trying to compare. It’s the potential risk, which is the excess credit creation in the last cycle. In that sense Brazil, China and Malaysia are all the same.”

Dredge co-manages the Convex Asia fund, a “volatility fund”, which manages about $US200 million and seeks to deliver outsized gains in times of market stress.

Stay ahead of spreading fire

He says he’s attempting to stay ahead of the spreading fire and that means looking for cheap exposures to volatility. Interest rate volatility is low and, while foreign currency volatility may have risen, it is below many of the peaks reached over the past five years. Corporate credit spreads, too, are around post-financial crisis lows despite a fair-sized correction in corresponding equities.

“This is indicative that we’re just at the very beginning of this,” Dredge says.

Where does Australia fit in as the cycle turns dark for emerging markets? We’re special in the sense that we have not pegged our currency to the US.

“It is just about the only non-manipulated currency in the entire world, along with New Zealand. By allowing the currency to move and avoid being a hard linkage to the monetary policy whims of the global reserve currency, it takes a lot of the pressure off.”

But there has still been a build-up of risks as credit has grown virtually interrupted and our economic linkages to China make us vulnerable to, not immune from, any shocks.

“Australia came through many of the last several cycles better than most because most of the volatility was allowed to take place in the currency.

“This has allowed the asset volatility to be far less than it otherwise would have been. But that means credit has built up and imbalances, while far less than they would have been, have been allowed to persist.”


Related Posts

  • 61
    Deutsche Bank has fired three currency traders in New York as regulators worldwide ramp up their investigations into potential manipulation of the $5-trillion-a-day foreign exchange market, according to a person briefed on the matter. The three employees include the head of Deutsche Bank’s emerging markets foreign exchange trading desk in…
    Tags: exchange, foreign, currency, markets, emerging, trading, market, fire
  • 61
    The move in March by the People’s Bank of China (PBOC) to double the RMB’s daily trading band from 1 percent to 2 percent has coincided with a new era of exchange rate volatility. This year, the long running trend of RMB appreciation has reversed course with it losing 3.4 percent against…
    Tags: currency, fx, trading, markets, global, exchange, china
  • 59
    The hedge fund industry used to have humble beginnings: in 1990, it had $40 billion in assets under management. Now, its growing appeal has led to a staggering $2.6 trillion in 2013. In retrospect with the mutual funds industry and the global financial markets, this is a small figure. However,…
    Tags: hedge, fund, trading
  • 58
    What is a Hedge Fund?  A hedge fund is an aggressively managed investment fund that is maintained by a professional management firm. Hedge funds are typically a portfolio of investments that makes use of advanced and complex investment strategies like short and long positions, leveraged positions, arbitrage, and derivative positions…
    Tags: hedge, fund, trading
  • 58
    Currency traders are having their worst start to a year since 2010 as a dearth of trends in major foreign-exchange markets crushes their investment strategies. Deutsche Bank AG’s Currency Returns Index has dropped 0.3 percent since Dec. 31, dragged down by momentum trading, where investors looks for consistent moves in…
    Tags: currency, trading, years, markets

Why are hedge funds not updating data ?

Examining the HSBC Hedge Weekly voluntary performance update, it appears certain hedge funds, after some of the most volatile markets in years, have not been quick to post their performance, while others, such as Roy Niederhoffer, have enjoyed the recent market volatility.

HSBC 8 28

Hedge funds: Greenlight and Glenview hedge funds slow to report, while JPMorgan and Odey report mid-August update

Greenlight Capital’s David Einhorn, running $4 billion, for instance, has not been very quick to update his fund’s performance.  As of July 31 Greenlight was negative by -6.3 percent on the month and is off -9.32 percent on the year. Larry Robbins of Glenview Capital Partners has likewise not updated his $4.7 billion fund’s performance. It was off -2.04 as of July but was nonetheless up 4.87 on the year.

Funds with a European focus have been quicker to update their performance. JPMorgan’s Europe Dynamic Long / Short Fund, run by Jonathan Ingram, John Baker and Anis Lahlou-Abid, was up 1.83 percent on the month as of August 21, and is up 9.23 percent on the year. Crispen Odey 2.7 billion (euro) European Fund was up 1.9 percent on the month as of August 14, but was still down -11.84 percent on the year.

Hedge funds: Neuberger Merman, Lansdowne, Trian, Pershing Square and Marcato all report August performance

Neuberger Berman’s US Long Short Equity fund was quick to report and as of August 26 it was down -3.33 percent on the month and -2.88 percent on the year. The $9.7 billion Lansdowne Market fund as of August 21 was up 0.51 percent on the month and 10.71 percent on the year. The equity diversified US focused Marcato International, operated by Richard McGuire with $3.3 billion under management, was down -4 percent as of Aug 14 and is down -3.08 percent on the year.

Another fund to update performance on a relatively recent basis was Nelson Peltz $2.9 billion Trian Partners, which was down -2.75 month and -1.35 on the year as of August 21. The $6 billion Pershing Square Capital Management reported they were down 2 percent as of August 18, and was up 6.95 percent on the year. ValueWalk this morning reported more up-to-date performance for NAV, noting Pershing Square was down 13 percent in August.

Brevan Howard Asia Fund, with $2.6 billion under management, reported as of July 31 they were positive by 3.25 percent on the year, while the flagship Brevan Howard Fund, in the diversified global category with $21 billion under management, was up 1.96 percent on year as of July.

Top and Bottom 20 Hedge Funds August 28th, 2015 Hedge funds

Top and Bottom 20 Hedge Funds August 28th, 2015 Hedge funds

Paul Tudor Jones, Man AHL and Roy Niederhoffer like August

Paul Tudor Jones $8.4 billion Tudor BVI Global fund reported performance as of Aug 21 up 2.35 percent on the year, 0.36 percent positive on the month. Man AHL Alpha and its $3 billion under management were reported up 2.44 percent on the month and positive 3.99 percent on the year August 21, while Roy Niederhoffer enjoyed the recent volatility, he was up 6.4 percent on the month as of August 26.

In explaining the recent market behavior, Niederhoffer told ValueWalk:

While it is easy – and a constant of history — to place the blame on “speculators” for any market move that goes against the preferred direction, it’s almost always the case that the presence of speculators in a market adds, rather than removes, liquidity in a market. In fact, it may be the unnaturally low volatility in the equity market, which went nearly four years without a correction, was the positive result of a great deal of “speculation” that the market would rally. The current burst of volatility is merely a return to normal levels of volatility. Corrections of 5-10% in the stock market are quite common in history. Going four years without one is actually quite rare. Even current levels of volatility are nothing compared to truly turbulent markets like 2000 and 2008.

That having been said, I do expect volatility to be higher going forward, in keeping with the Fed’s decision to end QE (for now). QE certainly had a dampening effect on equity volatility, and I would expect a lack of QE, and a potential tightening in the future, to cause more volatility in the future. So yes – fasten your seatbelts!

source : http://www.valuewalk.com/2015/08/hedge-fund-august-returns/

Related Posts

  • 78
    The hedge fund industry used to have humble beginnings: in 1990, it had $40 billion in assets under management. Now, its growing appeal has led to a staggering $2.6 trillion in 2013. In retrospect with the mutual funds industry and the global financial markets, this is a small figure. However,…
    Tags: hedge, funds, fund, trading
  • 78
    What is a Hedge Fund?  A hedge fund is an aggressively managed investment fund that is maintained by a professional management firm. Hedge funds are typically a portfolio of investments that makes use of advanced and complex investment strategies like short and long positions, leveraged positions, arbitrage, and derivative positions…
    Tags: hedge, funds, fund, trading
  • 69
    Czech Republic wants a piece of the rising hedge fund industry, after a new EU regulation named AIFMD (Alternative Investment Fund Manager Directive)  takes effect in July. Previously the highest number of hedge funds, after the U.S., are domiciled in Luxembourg, a tiny EU state. But the new EU rules, which…
    Tags: hedge, funds, fund, trading
  • 68
    Commodity Futures Trading Commission data show the most-bullish six-week change to Aussie positions in more than 1 1/2 years over the period to April 22, just in time to catch a slump that made the local dollar the past week’s worst performer among 10 currencies tracked by Bloomberg Correlation Weighted…
    Tags: year, percent, market, funds, trading, hedge
  • 68
    George Soros is 84 today. His career is remarkable both for its longevity and its returns – his Quantum fund has generated $39.6 billion in profits over the last four decades, making Soros the most successful hedge fund manager in history. How has Soros managed to stay at the top for so long?…
    Tags: fund, billion, $, year, trading

Do you own Gold ? You should … Listen why

“If you dont own gold…there is no sensible reason other than you dont know history or you dont know the economics of it”


Ray Dalio is an American businessman and founder of the investment firm Bridgewater Associates.

Related Posts

  • 72
    The following conversation took place at Harvard University. Former U.S. Treasury Secretary, Larry Summers invited Ray Dalio, founder and chairman of Bridgewater Associates, the world’s largest hedge fund, to discuss Dalio’s unique views on economics. The conversation is based off of Dalio’s 30-minute animated video entitled “How the Economic Machine…
    Tags: dalio, ray, economics, associates, bridgewater, founder, economy
  • 47
    Follow up of my post on BIG COMPANIES NOW HAVE A HAND IN THE COLLABORATIVE ECONOMY Here is one picture.
    Tags: economy
  • 47
    http://www.teslamotors.com/sites/default/files/blog_attachments/gigafactory.pdf
    Tags: economy
  • 46
    The world's next credit crunch could make 2008 look like a hiccup Is this why central bankers are so scared of raising interest rates?   A solar eclipse, a super moon, the FTSE 100 breaching 7,000 and the US Federal Reserve speaking in tongues - truly some kind of financial…
    Tags: dalio, ray, founder, associates, bridgewater, american, economy
  • 45
    This is a story about ARM Holdings (ARMH), the mobile technology company. But before it gets going, here are a few things you need to know: 1. ARM is a company made up mostly of chip engineers. They design parts of chips—such as graphics and communication bits—and they design entire…
    Tags: economy

BIG MARKET NEWS WEEK 13 APR 2015 – 17 APR 2015

China Monday, April 13, 2015 04:00
CNY Trade Balance (Mar)
New Zealand Tuesday, April 14, 2015 00:00  
NZD     NZIER Business Confidence (QoQ) (Q1)
United Kingdom Tuesday, April 14, 2015 10:30  
GBP Consumer Price Index (MoM) (Mar)
United States Tuesday, April 14, 2015 14:30  
USD Retail Sales ex Autos (MoM) (Mar)
United States Tuesday, April 14, 2015 14:30  
USD Retail Sales (MoM) (Mar)
United States Tuesday, April 14, 2015 14:30  
USD Producer Price Index (MoM) (Mar)
China Wednesday, April 15, 2015 04:00  
CNY Industrial Production (YoY) (Mar)
China Wednesday, April 15, 2015 04:00  
CNY Gross Domestic Product (QoQ) (Q1)
European Monetary Union Wednesday, April 15, 2015 13:45  
EUR ECB Interest Rate Decision
Canada Wednesday, April 15, 2015 14:30  
CAD     Manufacturing Shipments (MoM) (Feb)
European Monetary Union Wednesday, April 15, 2015 14:30  
EUR ECB Monetary policy statement and press conference
Canada Wednesday, April 15, 2015 16:00  
CAD BoC Interest Rate Decision
Canada Wednesday, April 15, 2015 16:00  
CAD BOC Rate Statement
Canada Wednesday, April 15, 2015 17:00  
CAD Bank of Canada Monetary Policy Report
Canada Wednesday, April 15, 2015 18:15  
CAD BoC Press Conference
Australia Thursday, April 16, 2015 03:30  
AUD Participation Rate (Mar)
Australia Thursday, April 16, 2015 03:30  
AUD Unemployment Rate s.a. (Mar)
Australia Thursday, April 16, 2015 03:30  
AUD Part-time employment (Mar)
Australia Thursday, April 16, 2015 03:30  
AUD Fulltime employment (Mar)
Australia Thursday, April 16, 2015 03:30  
AUD Employment Change s.a. (Mar)
United States Thursday, April 16, 2015 14:30  
USD Building Permits (MoM) (Mar)
United States Thursday, April 16, 2015 14:30  
USD Initial Jobless Claims (Apr 10)
United States Thursday, April 16, 2015 16:00  
USD Philadelphia Fed Manufacturing Survey (Apr)
Switzerland Friday, April 17, 2015 09:15  
CHF Real Retail Sales (YoY) (Feb)
United Kingdom Friday, April 17, 2015 10:30  
GBP Average Earnings including Bonus (3Mo/Yr) (Feb)
United Kingdom Friday, April 17, 2015 11:30  
GBP Claimant Count Change (Mar)
United States Friday, April 17, 2015 14:30  
USD Consumer Price Index (YoY) (Mar)
United States Friday, April 17, 2015 14:30  
USD     Consumer Price Index Ex Food & Energy (YoY) (Mar)
Canada Friday, April 17, 2015 14:30  
CAD Consumer Price Index (YoY) (Mar)
Canada Friday, April 17, 2015 14:30  
CAD Bank of Canada Consumer Price Index Core (YoY) (Mar)
United States Friday, April 17, 2015 16:00  
USD Reuters/Michigan Consumer Sentiment Index (Apr)Preliminar

Related Posts

  • 83
    Greece Monday, Dec. 29, 2014 24h EUR Presidential elections United States Tuesday, Dec. 30, 2014 16:00 USD Consumer Confidence (Dec) China Wednesday, Dec. 31, 2014 02:45 CNY HSBC Manufacturing PMI (Dec) United States Wednesday, Dec. 31, 2014 14:30 USD Initial Jobless Claims (Dec 19) China Thursday, Jan. 1, 2015 02:00…
    Tags: united, usd, states, trading, calendar
  • 81
    Greece Sunday, January 25, 2015 n/a   EUR Hellenic Parliament Elections Germany Monday, January 26, 2015 10:00   EUR IFO - Business Climate (Jan) Australia Tuesday, January 27, 2015 01:30   AUD National Australia Bank's Business Confidence (Dec) United Kingdom Tuesday, January 27, 2015 10:30   GBP Gross Domestic Product…
    Tags: united, usd, states, wednesday, trading, calendar
  • 76
    All time are GMT+2 Australia     Tuesday 13 May, 2014   11:30     AUD Budget Release Germany   Wednesday 14 May, 2014   08:00       EUR Harmonised Index of Consumer Prices (YoY) (Apr) United Kingdom     Wednesday 14 May, 2014   10:30     GBP…
    Tags: united, usd, states, wednesday, trading, calendar
  • 68
    This Week : April 5 – April 11   Spain Monday, April 6, 2015 09:00 EUR Unemployment Change (Mar) Canada Monday, April 6, 2015 16:00 CAD     Ivey Purchasing Managers Index s.a (Mar) United States Monday, April 6, 2015 16:00 USD ISM Non-Manufacturing PMI (Mar) Australia Tuesday, April 7,…
    Tags: april, mar, united, calendar
  • 66
    This Week : April26 – May2   Australia Tuesday, April 28, 2015 00:40   AUD       RBA's Governor Glenn Stevens Speech United Kingdom Tuesday, April 28, 2015 10:30   GBP       Gross Domestic Product (QoQ) (Q1)Preliminar United States Tuesday, April 28, 2015 16:00   USD Consumer…
    Tags: april, united, wednesday, usd, calendar

What do you think ? Do we need “Quantitative Easing for the People” instead ?

ECB’s QE programme launched this month is targeting wrong policy and likely to fuel an already massive bubble in stocks and bonds. It is also unlikely to help generate real economic growth, as it simply transfers more wealth to the financial markets.

Look at the facts: 

  • The Eurozone is suffering from structural stagnation that is driven by the lack of investment, anaemic domestic demand and policies, including taxation and enterprise regulation, that reduce entrepreneurship and make jobs creation and productivity growth (especially Total Factor Productivity) excessively costly.
  • Overall household and corporate indebtedness in the Euro area remain high despite several years of deleveraging.
  • Bank lending markets fragmentation contrasted by booming equity and bond markets shows that the problem is not in the lack of liquidity, but in over-leveraging present in the economy.


Experience in other countries
that recently deployed QE shows that current measures by the ECB are unlikely to provide sufficient stimulus to drive growth to the new (and higher) ‘normal’:

  • Japan, the US, and the UK experiences with QE show that monetary policies are useful to the real economy only when they are combined with either expansionary fiscal policies or real investment increases or both.
  • Even in such cases where QE has been successful, sustainability of QE-triggered growth has been weak in the presence of structural debt overhangs (Japan) and had to rely on structural drivers for growth present prior to the deployment of QE (the UK and the US).
  • In the Euro area, the idea is to combine QE with austerity policies and in the presence of dysfunctional financial markets. Such a program could increase misallocation of resources via bidding up financial assets prices over and above their long term fundamentals-justified levels.
  • Bank of England created £375bn over the course of its QE programme. By the Bank of England’s own estimates, QE in the UK pushed up share and bond prices by around 20%. But because around 40% of stock market wealth is held by the wealthiest 5% of households, QE has made that wealthiest 5% better off by around £128,000 per household.
  • You might want to check this post on the potential effects of QE on the real economy:http://www.zerohedge.com/news/2015-03-28/finally-very-serious-people-get-it-qe-will-permanently-impair-living-standards-gener


In short: the QE, as currently being carried out by the ECB, benefits the less-productive holders of financial assets, not the poor, nor the entrepreneurs, nor the real enterprise.

There is an alternative policy, a policy of “Quantitative Easing for the People”, an idea of distributing QE money directly to the citizens of the Euro area.

This is a more efficient approach for stimulating the real economy precisely because it puts liquidity directly at the point where it is needed most and can be used most efficiently, absent intermediaries, to address real structural problems present in the economy.

The plan is identical to the ECB current plan in terms of funds allocated: €60 billion will be created each month for 19 months. The amount each national central bank will create can also depend on its share of capital in the ECB, just as the current ECB QE programme envisages.

Each Eurozone citizen can receive ca €175 on average each month for 19 months.

  • The funds are taxable income, so there is a benefit to the Exchequers, allowing the governments to engage in expanded investment programmes or more efficiently close some of the budgetary gaps, while buying more time to implement structural reforms.
  • The funds (net of tax) can be used by households to accelerate debt deleveraging and/or repair their pensions funds and/or fund consumption.
  • As the result, “QE for the People” will stimulate domestic demand (consumption, investment and Government investment), while increasing the rate of debt deleveraging.
  • In addition, “QE for the People” can help improve banks’ balancesheets by increasing loans recovery (as households repay loans). In contrast, ECB QE will not have such an effect as it will be taking off banks balancesheets zero risk-weighted Government bonds.  Thus, “QE for the People” can be seen as a more efficient mechanism for repairing financial system transmission mechanism than ECB own QE policy.
  • The quantum of stimulus implied by the “QE for the People” proposal is significant. Take Ireland, for example. “QE for the People” means annual benefit of around EUR8 billion in direct stimulus (depending on how Ireland’s share is estimated). In 2014, Irish Final Domestic Demand grew by EUR6.15 billion. So the direct effect of this measure for just one year would be equivalent to more than full year worth of real economic growth.


19 economists from across Europe and outside signed last week’s FT letter proposing this plan (with some variations) to stimulate the real economy in the euro area. The original letter is available here:http://www.basicincome.org/news/2015/03/europe-quantitative-easing-for-people/.


Source : http://trueeconomics.blogspot.se/2015/03/31315-qe-for-people.html

Related Posts

  • 79
    https://www.youtube.com/watch?v=ZWz_Pln_uuI
    Tags: trading
  • 77
    http://www.swfinstitute.org/fund-rankings/
    Tags: trading
  • 76
    Forex: 10 Events to Watch Next Week In order of release 1. UK Consumer Price Index (Aug 19) 2. New Zealand Dairy Auction (Aug 19) 3. RBA Semi-Annual Testimony (Aug 19) 4. Bank of England Minutes (Aug 20) 5. FOMC Minutes (Aug 20) 6. HSBC China Manufacturing PMI Aug Flash…
    Tags: trading
  • 74
    In announcing a new round of extraordinary measures to support the euro-area recovery, the European Central Bank is sending three loud and unambiguous messages. Their implications extend well beyond Europe. First, it is committed to experimenting even more with its use of unconventional monetary policy, including by taking the deposit…
    Tags: growth, trading, ecb
  • 72
    The optimal portfolio of risky assets is exactly the same for everyone : 1. Investors should control the risk of their portfolio not by reallocating among risky assets, but through the split between risky and risk-free assets. 2. The portfolio of risky assets should contain a large number of assets…
    Tags: trading